
Most landing page advice treats one percentage as a verdict. Divide conversions by visitors, match the result to a published "good" rate, and decide the page is winning or failing. That routine looks exact and still answers the wrong question.
A landing page conversion rate calculator only helps when you lock the conversion event and the base you divide by. An email signup, a finished quiz, a click off an advertorial, and a paid order are different jobs. Unique users, sessions, and ad clicks are different bases. The same orders, run through two bases, produce two rates that both look official.
Paid social makes the gap wider. Consent loss, modeled conversions, and checkout handoffs mean Meta, GA4, and Shopify can each report a different purchase count for the same ads. A lower number is sometimes cleaner measurement, not a weaker page.
Pick one event, one denominator, and one date window. Log the rate. Then read it against a median for a similar page, and against what each buyer cost you.
Table of Contents
- The Conversion Rate Formula With Worked Examples
- How to Run the Calculator Step by Step
- Choosing the Right Denominator and Conversion Event
- Benchmarks That Show Whether Your Rate Is Good
- Using the Calculator for DTC and Paid Social Pages
- Reading CAC and Lift Estimates From Your Results
- Why Platform Numbers Differ From Your Calculated Rate
- Set Your Baseline and Start Your First Test
The Conversion Rate Formula With Worked Examples
The calculator runs one line.
Conversion rate = (conversions ÷ chosen denominator) × 100
The numerator is the event you named. The denominator is the traffic base you named. Change either one and the percentage changes, even when the page itself did not.
Four events a DTC brand actually counts
Say a skincare brand runs cold Meta traffic and logs four pages over the same two weeks. Each row counts a different event, so these rates are not a ranking.
| Page | Event counted | Base | Count | Rate |
|---|---|---|---|---|
| Email signup | Signup | 5,000 visitors | 175 | 3.5% |
| Product page | Purchase | 8,400 sessions | 126 | 1.5% |
| Quiz page | Completed quiz | 2,500 visitors | 400 | 16.0% |
| Advertorial | Click onward to the product page | 12,000 ad clicks | 960 | 8.0% |
Signup at 3.5% is a lead on visitors. Purchase at 1.5% is an order on sessions. Quiz completion at 16.0% counts people who finished a form, not people who paid. Click-through at 8.0% counts a handoff from ad clicks, not a sale. Putting 16.0% above 1.5% and calling the quiz "better" mixes four questions into one scoreboard.
Multiply back before you trust the cell
Take the signup row. 175 divided by 5,000 is 0.035. Times 100, that is 3.5%. Audit every row the same way. The rate as a decimal, times the denominator, must return the conversion count. 0.015 times 8,400 is 126. 0.16 times 2,500 is 400. 0.08 times 12,000 is 960. If the product is off by more than rounding, the two columns came from different exports.
Practical rule: Divide only when the numerator and denominator count the same thing over the same dates.
A signup from a 7-day export cannot sit on a 30-day visitor total. A Shopify order cannot sit on Meta clicks unless that mismatch is the question you meant to ask. The next decision is which base belongs on the input line, because the formula will not choose it for you.
How to Run the Calculator Step by Step
Treat the landing page conversion rate calculator as a logged routine, not a one-off sum. The same six moves, in the same order, are what make next week's number comparable to this week's.
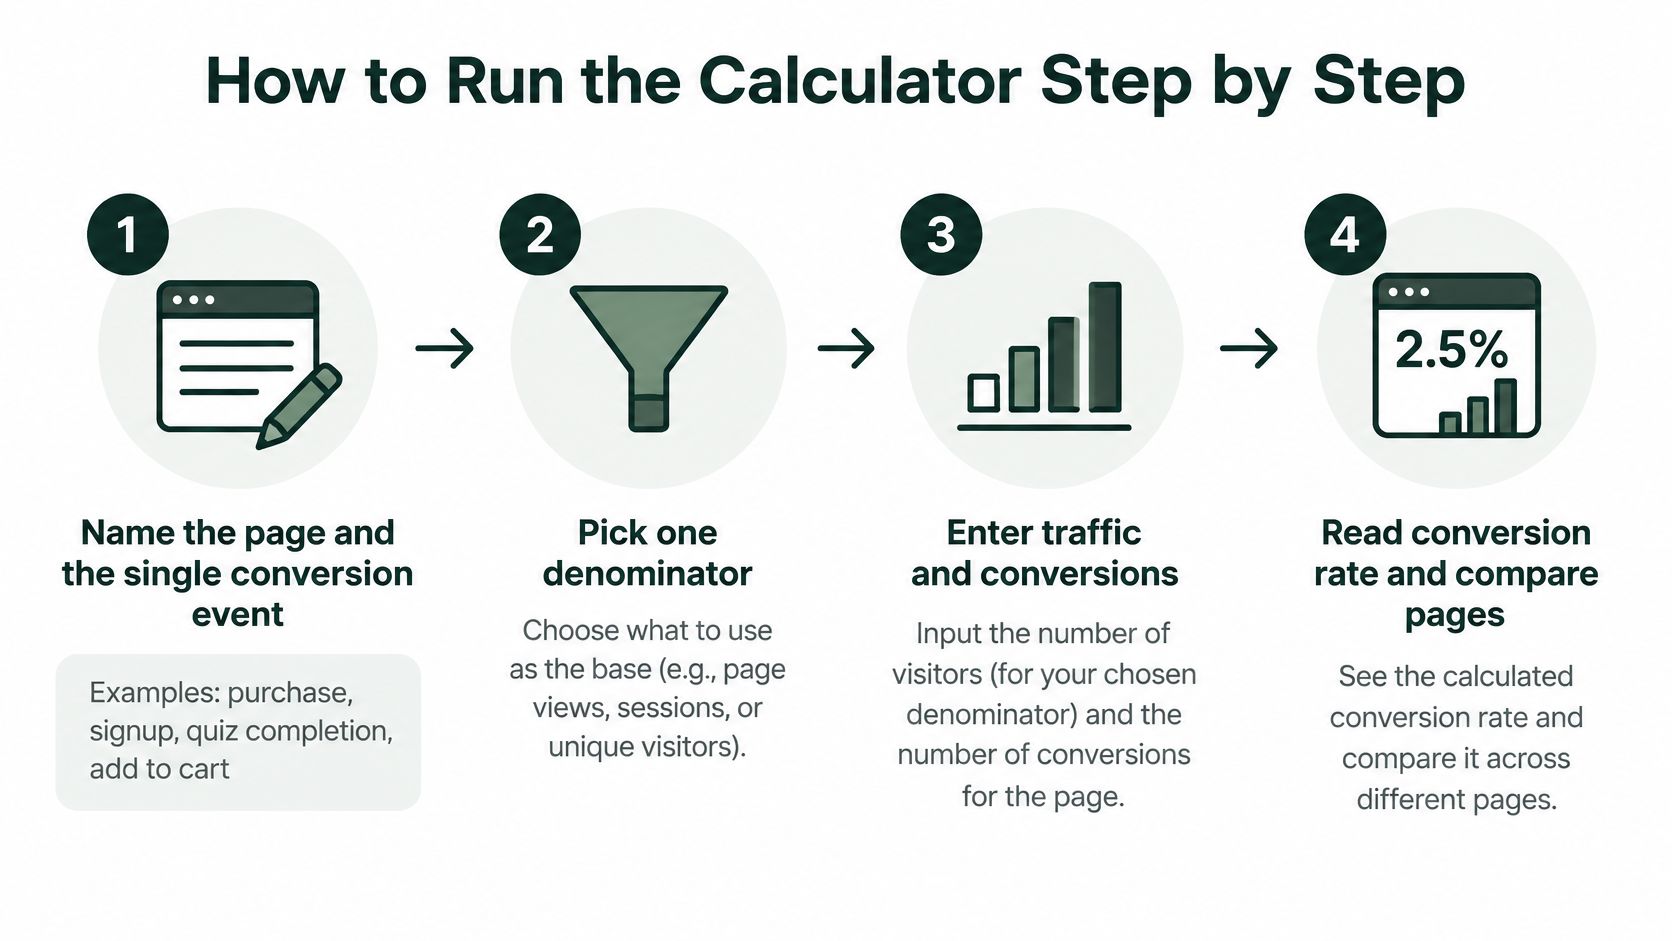
Name the page and one event. Write a short page label and a single goal, such as purchase, signup, quiz completion, or add to cart. The common slip is a column called "conversions" that mixes orders with add-to-carts. Those events do not share a scale, and the blended rate will look healthier than revenue.
Pick one denominator and label it. Choose users, sessions, ad clicks, or engaged visitors, and type that label on the input line. Stuffing mobile and desktop into one row hides a device problem inside a blended rate. You will "fix" copy that was never the issue.
Lock the dates and the source. Use the same window as your last report, and name the source, such as cold Meta or TikTok. Pulling seven days and comparing them with a 30-day benchmark creates a slump or a spike that is only a shorter sample.
Enter visitors and conversions, then check the ceiling. Conversions cannot exceed the denominator. If they do, you blended events, double-counted orders, or pulled the conversion column from a wider range than the traffic column.
Read the rate to one decimal place. 3.48% is 3.5% in the log. Compare it with a benchmark built on the same kind of event, not with a signup rate from another URL.
Log the row so the next run can match it. Store the date, the source, and the device split beside the rate. Without those three fields, you cannot tell a real move from a change in mix.
The sheet you can rebuild anywhere
A valid run is one event, one denominator, one window, and one logged row. In Google Sheets or Excel, use input fields for page name, conversion event, denominator type, date range, traffic source, device, visitors, conversions, and attribution window. Add a validation cell that flags any row where conversions exceed the denominator. Add an output cell that returns the rate to one decimal place beside the benchmark range for that event.
If validation flags a row, leave it out of the weekly average. Fix the export first. A clean log is what lets a later test mean something, because you will know which definition produced the number you are trying to beat.
Choosing the Right Denominator and Conversion Event
A single formula is the popular shortcut, and it is why teams argue past each other. Users, sessions, clicks, and qualified visitors are not interchangeable. One person can generate several sessions. Ad-platform clicks can include accidental taps, bots, duplicate visits, or people who never fully load the page. Google Analytics percentile benchmarks are built from aggregated peer groups, so they only help when your definition matches the comparison and the business context.
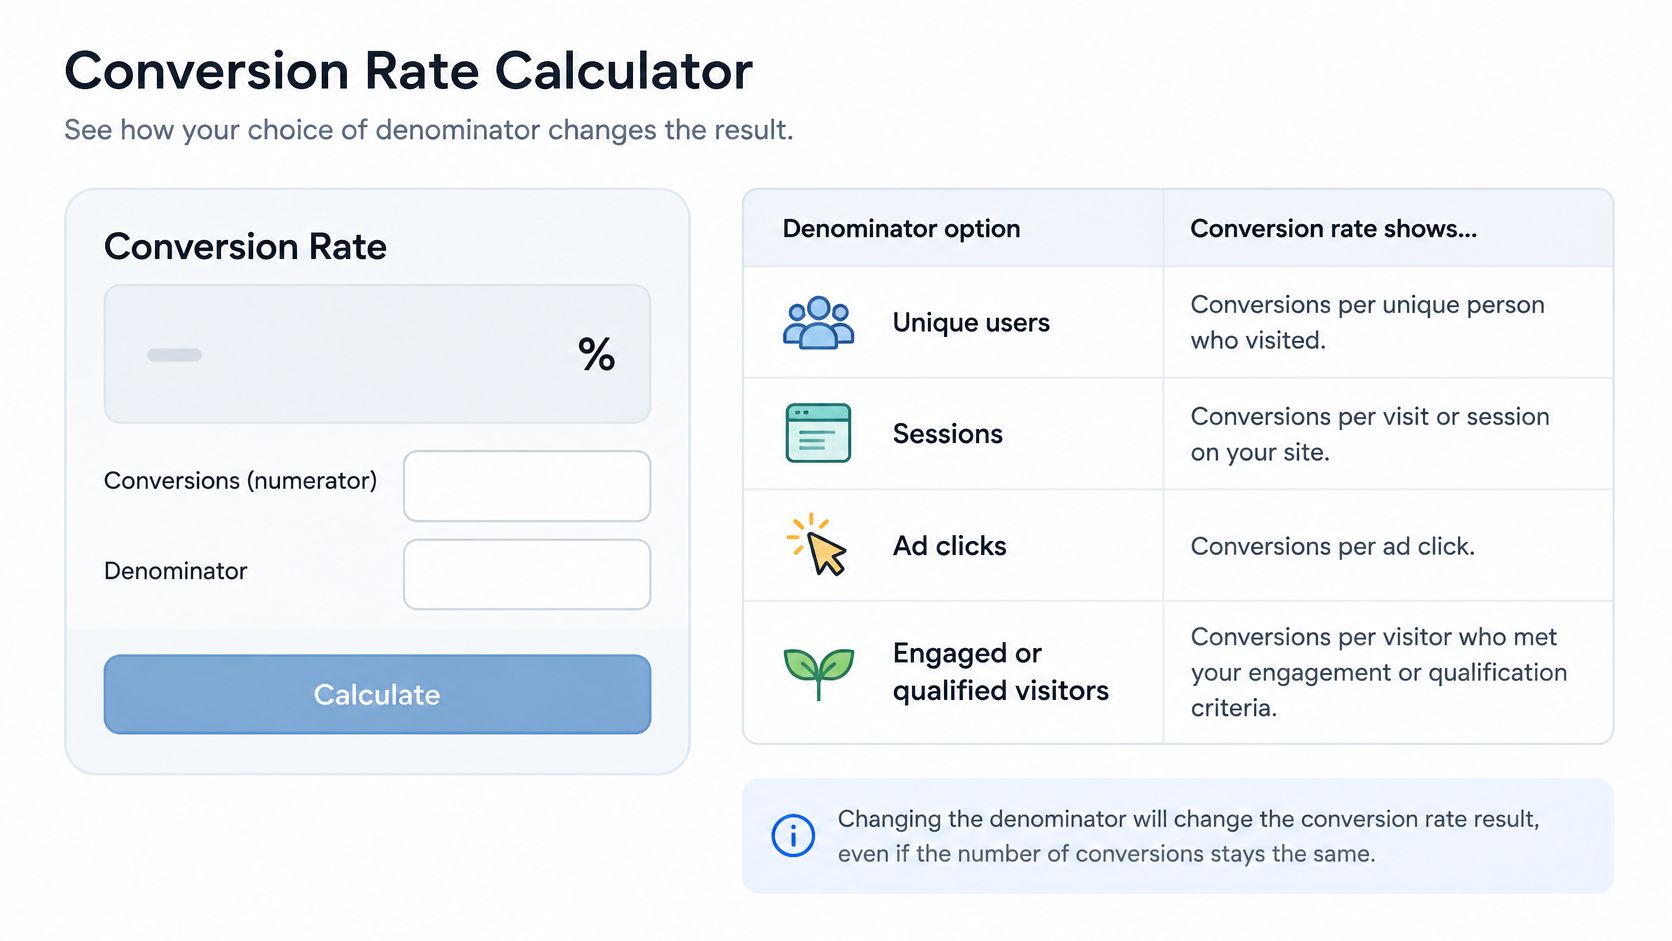
Say 800 people create 1,000 sessions and place 40 orders. The session rate is 40 ÷ 1,000, or 4.0%. The user rate is 40 ÷ 800, or 5.0%. Same orders. The session rate looks worse because repeat visits inflate the base. Neither figure is wrong. Comparing a user rate with a benchmark built on sessions is.
Denominators and when each one fits
| Denominator | What it counts | Best use | Watch-out |
|---|---|---|---|
| Unique users | People who visited at least once | Reach of a page across a campaign | Returning visitors are counted once, so rates look higher |
| Sessions | Visits to the page | Day-to-day monitoring of one page | Repeat visits inflate the base and lower the rate |
| Ad clicks | Clicks reported by Meta or TikTok | Judging click quality from the ad | Includes accidental taps and bots; some clicks never load the page |
| Engaged or qualified visitors | Sessions that pass a defined engagement threshold | Comparing advertorial reads with product intent | The threshold must be defined once and kept fixed |
Match the base to the page's job.
- Ad clicks answer whether the ad sent real attention, or a pile of taps that never rendered.
- Sessions answer how the URL behaves day to day, including people who come back.
- Engaged visitors answer whether an advertorial was read. Fix the threshold once, such as a time on page plus a scroll depth, and do not tighten it after a bad week.
- Completed orders answer the commercial outcome. Keep add-to-cart as its own row so a micro event cannot inflate the headline.
Which conversion event should you use when the landing page is only one step in the funnel? Choose by the page's role and the commercial outcome, not by a generic industry benchmark.
A presell advertorial and a product page do different work. The advertorial can show a lower immediate click-through rate and still be the better buy if more of the people who continue go on to purchase, or if CAC falls. Judge that page on the downstream result. A calculator that prints one percentage will call it a loser and send you to rewrite the wrong screen.
Benchmarks That Show Whether Your Rate Is Good
A published rate is a reference, not a quota. Put your result next to a median from a large set, then ask whether the page, the device, and the event belong in that set at all.
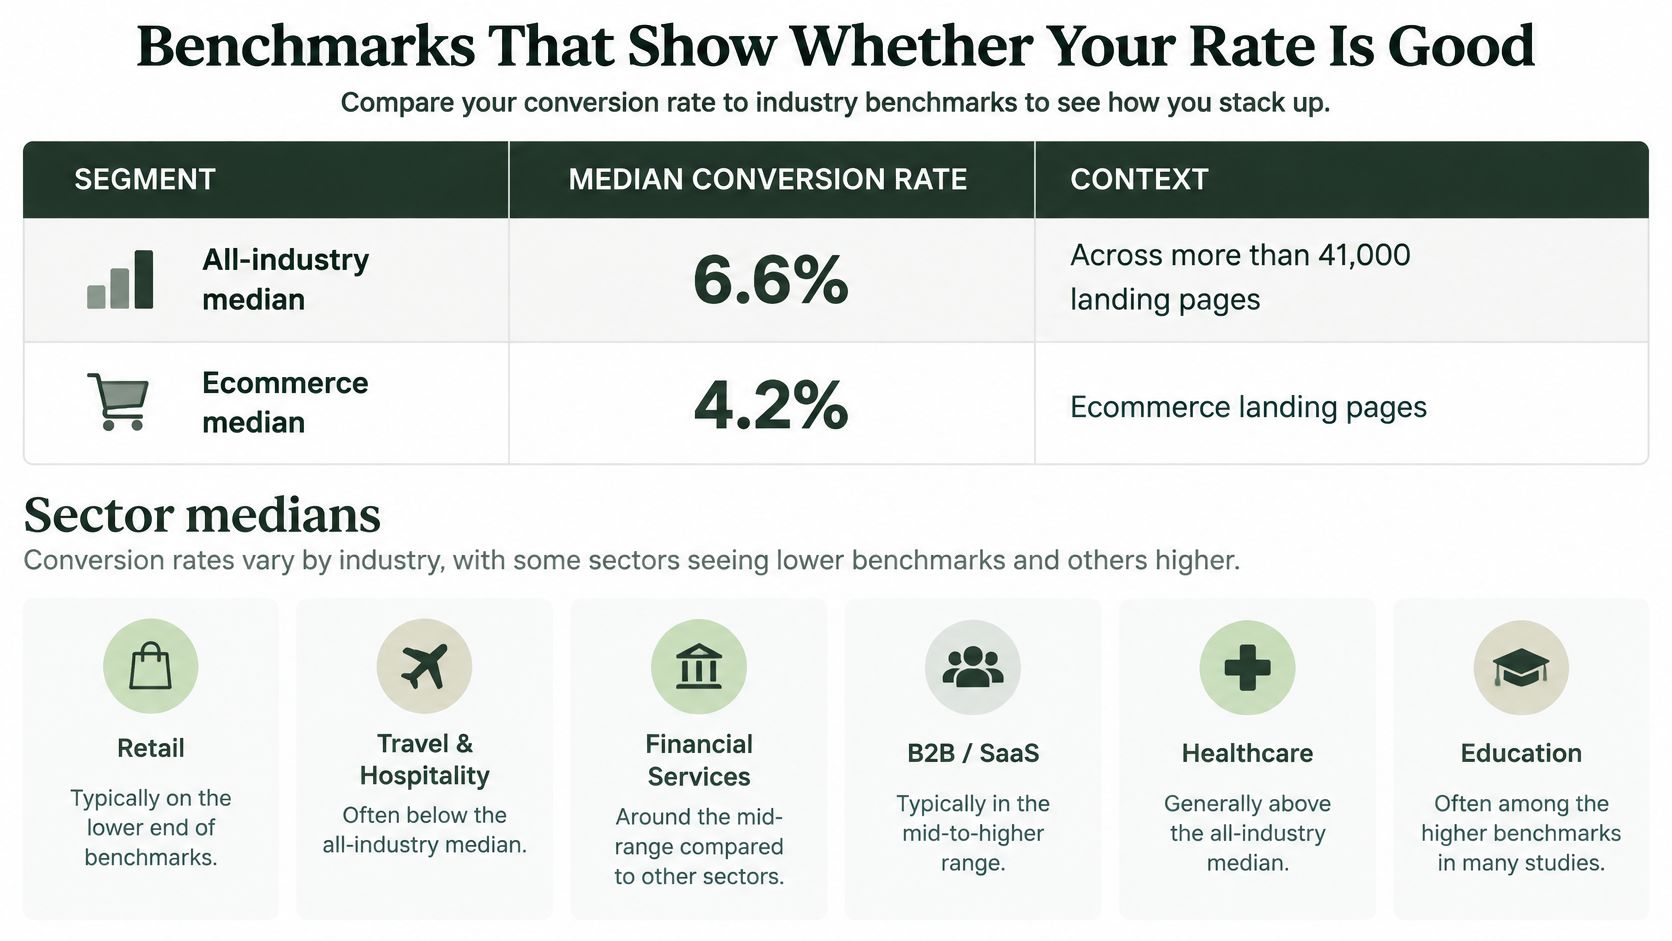
Landing page conversion benchmarks to compare against
| Segment | Reference value | Dataset | How to use it |
|---|---|---|---|
| All industries median | 6.6% | 2023 to 2024, over 41,000 pages | Broad reference only |
| Ecommerce median | 4.2% | 2023 to 2024 | Closest default for consumer-product pages |
| Lowest to highest sector median | 3.8% to 12.3% | 2023 to 2024 | Shows why sector matters |
| All industries median and average | 3.2% median, 9.7% average | 2020, 34,000 pages | Use the median; the average is distorted |
| Top 25 percent of pages | 25% median | 2020 | Ceiling for well-tuned offers, not a target |
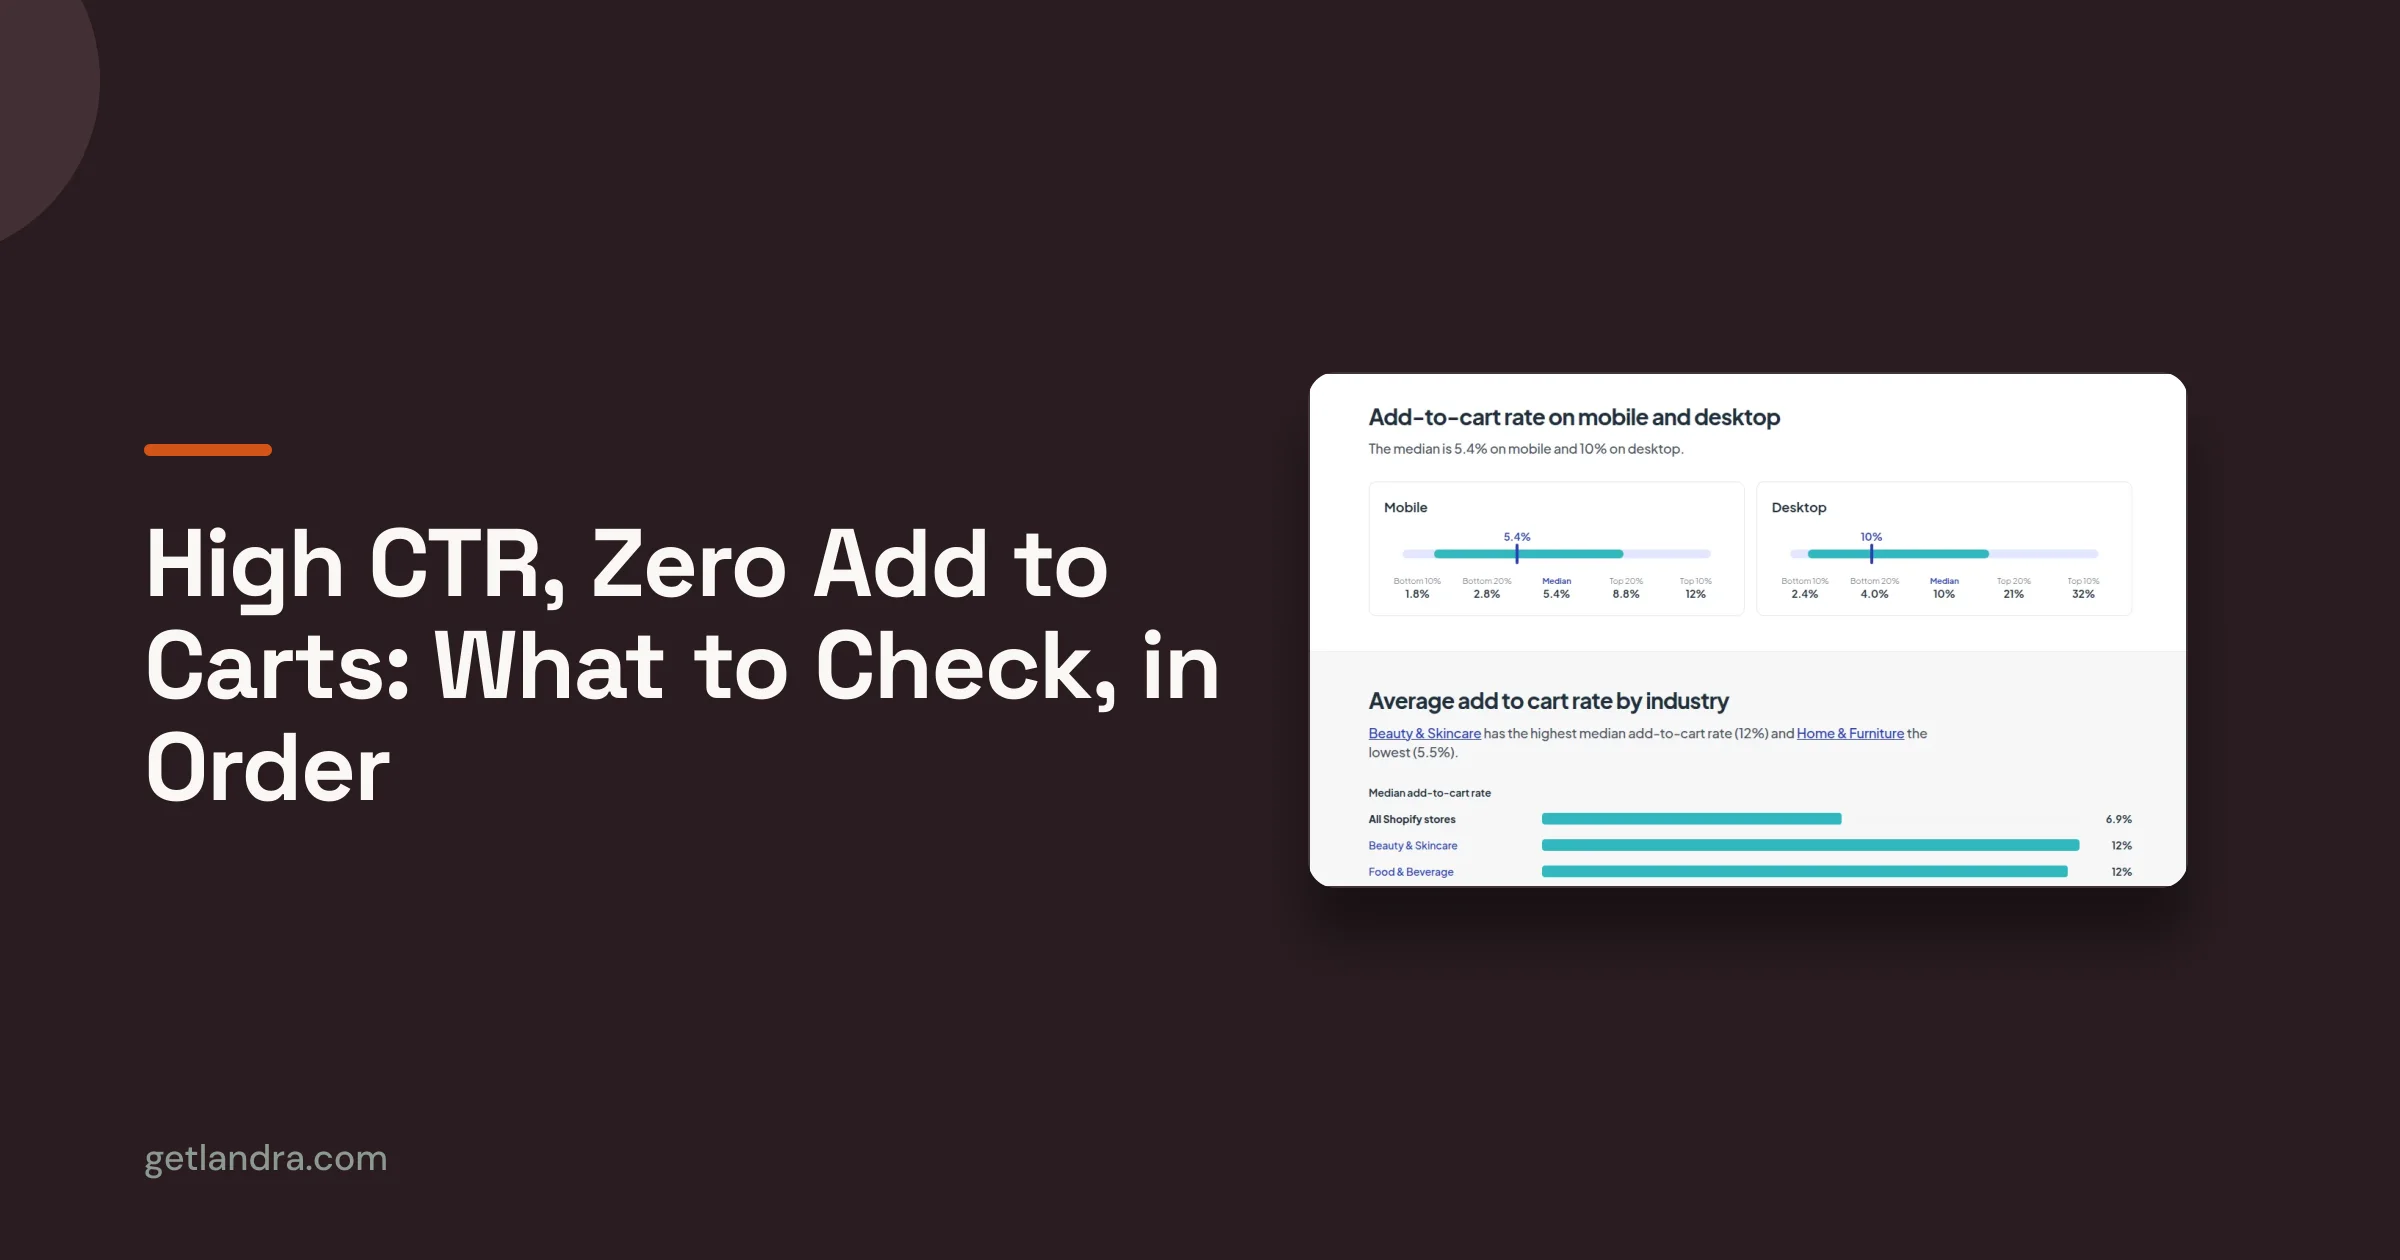
According to Unbounce's 2023–2024 analysis, data from July 23, 2023 through July 23, 2024 covered more than 464 million unique visitors, 57 million conversions, and over 41,000 landing pages, with an all-industry median of 6.6%, an ecommerce median of 4.2%, sector medians from 3.8% to 12.3%, and desktop converting 8% better than mobile even though mobile generated nearly five times more visitors. For a DTC presell or advertorial, separate click-through, lead capture, and completed purchase before you borrow any of those medians, because each event is a different stage. Our 2026 DTC landing page benchmarks carry that split into paid social.
The Unbounce 2020 benchmark report is why a calculator should prefer the median. Across 34,000 landing pages the overall median was 3.2% and the arithmetic average was 9.7%, while pages in the top 25% achieved a 25% median. A handful of exceptional offers pull the average far above what a typical page earns. If a tool calls 9% "average," it is describing outliers.
The same rate against two medians
A product page at 2.9% sits under the ecommerce median and deserves a diagnosis: message match, offer, speed, or traffic quality. That same 2.9% is even further under the all-industry median, but the wider gap is less useful for a store, because the all-industry set includes lead-gen pages with easier events. A product page at 5.1% sits above the ecommerce median. Protect it. Do not rebuild it because it misses the all-industry figure.
Segment by device before you compare. A blended rate can look weak when most sessions are mobile and desktop is carrying the orders. Conversion advice from MD TECH TEAM is a practical next read when you move from the benchmark check into on-page tests. Your own trend, on the same event and the same window, is still a stronger test than any published median.
Using the Calculator for DTC and Paid Social Pages
Take a DTC skincare brand that sends the same cold Meta ads to two URLs. Each URL gets $6,000 of spend. Nothing else in the account changes during the window.
The product page receives 4,000 sessions and 120 purchases. The rate is 120 ÷ 4,000, or 3.0%. CAC is 6,000 ÷ 120, or $50.00.
The advertorial receives 3,000 sessions and 180 purchases. The rate is 180 ÷ 3,000, or 6.0%. CAC is 6,000 ÷ 180, or $33.33. That is 50.00 minus 33.33, divided by 50.00, a 33.3% lower acquisition cost on the same budget.
Before you trust the gap, confirm those 3,000 sessions are engaged sessions, not raw ad clicks. Clicks that leave in a second inflate the base, shrink the rate, and are not the reads you paid for. If the advertorial was judged on clicks and the product page on sessions, the comparison is already broken.
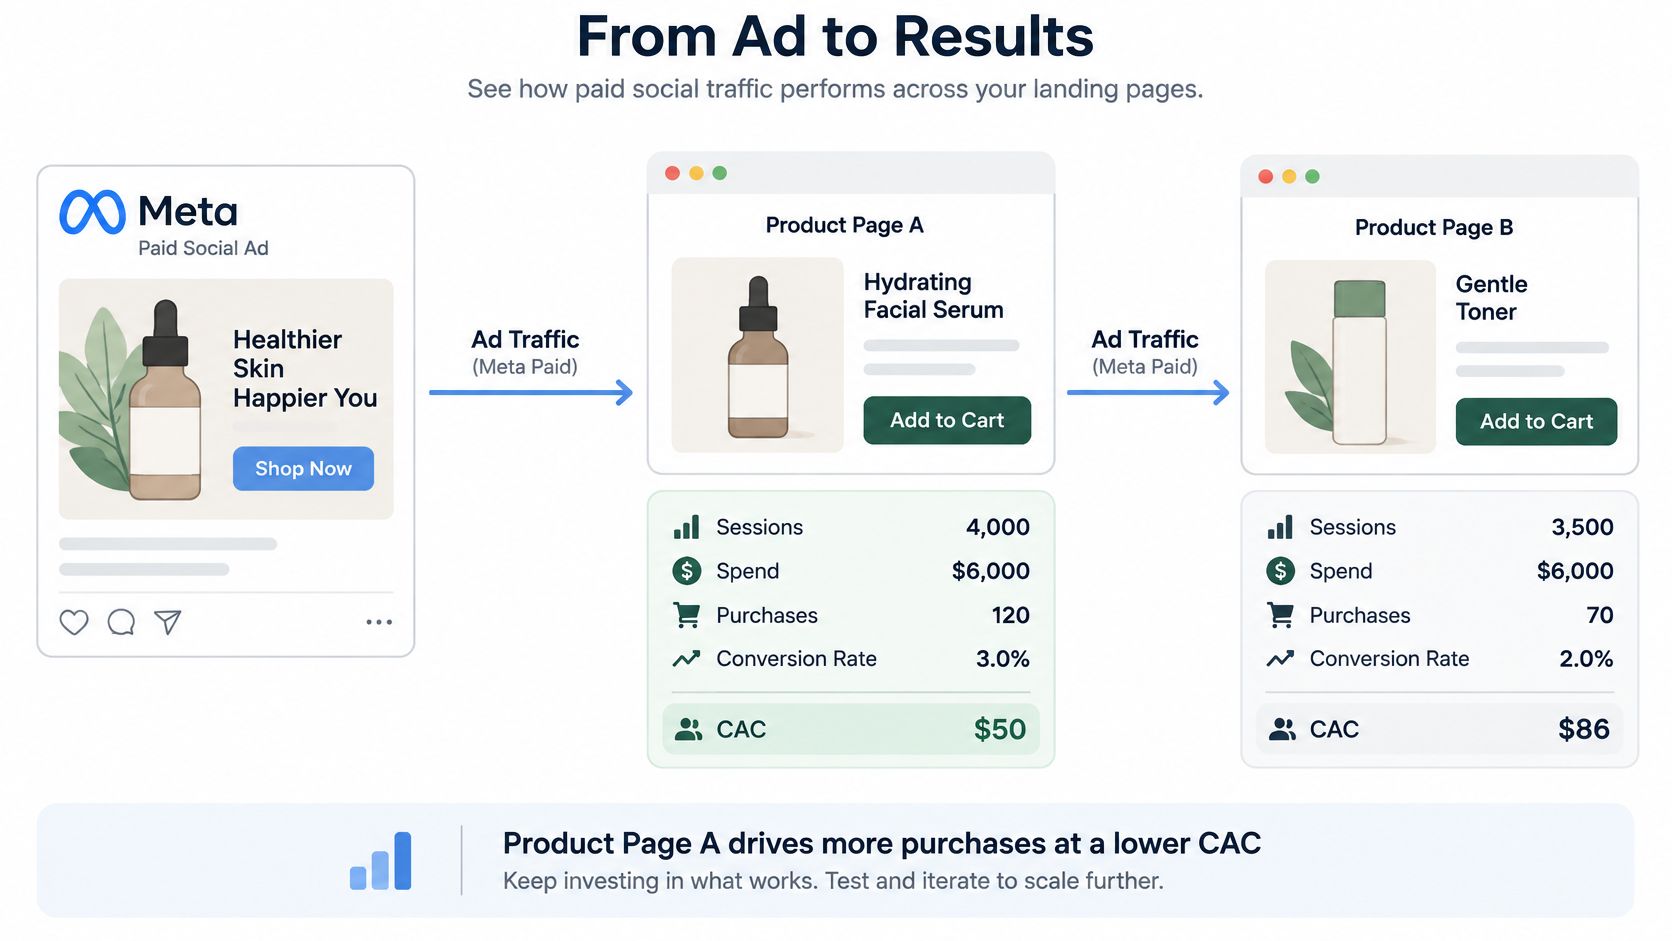
Three uses of the same log
Compare a presell page with the product page on one ad set. Hold creative, audience, and dates fixed. The URL is the only change. If you also swap the audience, you cannot tell whether the page or the traffic moved the rate.
Calculate CAC for each ad set on its own. A higher rate on a more expensive audience can still lose money. Put spend divided by purchases next to the rate for every ad set, including the ones that look strongest inside Ads Manager.
Track Meta and TikTok on separate weekly rows. Cold feed behavior is not the same on both platforms. A log with the source filled in stops a strong TikTok week from covering a weak Meta week, or the reverse.
Cold traffic usually needs a problem-led frame. A shopper who does not yet feel the problem bounces from a product page that opens like a closing argument. The advertorial's job is to make the problem concrete, then hand a warmer click to the product page.
There is a clean exception. For an impulse, low-price product, sending the click straight to the product page often wins, because the extra step loses more buyers than it educates. The calculator will show it. If the direct page has the lower CAC at a stable sample, keep the direct page and stop building a presell for that offer.
A page can convert fewer raw clicks and still be the one you scale, once you are sure those sessions were engaged and the buyers cost less.
Reading CAC and Lift Estimates From Your Results
Two formulas turn a rate into a budget decision.
CAC = ad spend ÷ conversions
Lift = (variant rate − control rate) ÷ control rate × 100
A control at 3.0% and a variant at 6.0% produces a lift of (6.0 − 3.0) ÷ 3.0 × 100, which is 100%. That is relative lift, not 100 percentage points. A move from 3% to 4% is about a 33% lift, which is easy to overread in a Monday standup.
Thin samples overstate the win
Lift from a small sample is often noise dressed up as a result. As a working rule, treat fewer than 100 conversions per variant as unreliable. Do not kill the control, and do not scale, until each side has cleared that count inside a window you set before launch. A page with a dazzling lift and 30 orders is a story, not a decision.
When the budget is fixed, a lower rate can still be the better page if those buyers were cheaper. Say one variant spends $2,000 to get 50 orders. CAC is $40. Another spends $2,000 to get 40 orders. CAC is $50, even if its rate looks prettier because the session base was smaller. Judge on CAC when spend is capped.
Reading CAC and lift results and choosing the next action
| Result pattern | What it means | Next action |
|---|---|---|
| Lift under 5% with fewer than 100 conversions per variant | Probably noise | Extend the test window before deciding |
| Lift under 5% with 100 or more conversions per variant | Real but small effect | Judge on CAC; a flat result is a valid answer |
| Lift 5 to 15% and CAC lower on the same budget | Promising direction | Confirm with a second run |
| Lift over 15% with CAC stable for two weeks | Strong candidate | Scale the variant and keep the control live |
| Lower rate but lower CAC | Cheaper buyers, not a weaker page | Judge on CAC rather than the rate alone |
| Higher rate but higher CAC | Page attracts costly clicks | Check ad and page match before changing copy |
Keep the control live after you name a winner. A second week can reverse a one-week spike, especially on cold social where auction prices move. If CAC rises as you add budget, the variant did not suddenly become a bad page. You may have used up the cheap slice of the audience. That is an ad-set problem. Rewriting the headline will not repair it. A flat result, confirmed on enough orders, is also an answer. It tells you to stop spending test traffic on that idea.
Why Platform Numbers Differ From Your Calculated Rate
The mismatch is often a measurement issue before it is a page issue. A conventional calculator assumes every visitor and every purchase can be tied together. On paid social, they cannot.
Google's description of conversion modeling states that browser restrictions, regulatory changes, and user privacy expectations create unobservable ad interactions and conversions, and that modeling uses aggregated signals such as historical conversion rates, device type, time, and geography rather than fingerprinting people. Google Analytics also models conversions for Consent Mode and for Apple's App Tracking Transparency. Ads Manager can include credit your store never recorded as a session.
Common mismatches between platform and calculated rates
| Symptom | Likely cause | Check or fix |
|---|---|---|
| Ad platform reports more purchases than Shopify | Modeled or view-through conversions | Compare within one system and record the attribution window |
| GA4 rate lower than the calculator rate | Consent loss or missing events | Check consent rate and confirm the purchase event fires |
| Checkout shows a different order count | Cross-domain tracking gap | Confirm the checkout domain is linked in analytics |
| Rate swings week to week | Small samples or a changing attribution window | Hold the window fixed and use weekly totals |
| Mobile rate far below desktop | Traffic mix and slow mobile load | Segment by device before judging the page |
Most gaps come from consent loss, a checkout on another domain, a different attribution window, modeled or view-through credit, and a different denominator. A 7-day click window plus a 1-day view window will not match a last-click store export. Neither number is "the" rate. Payment handoffs add another break when the order is completed on a domain analytics never joined.
Compare directional trends inside one analytics system before you compare absolute rates across Shopify, GA4, and Meta. If the store and GA4 move together and Ads Manager does not, investigate modeling and the window. Landra's attribution modeling guide shows how those windows can assign the same order to different days.
Put tracked visitors, consent rate, modeled conversions, checkout-domain continuity, and the selected attribution window next to the percentage. A lower reported rate can reflect stricter consent and less modeled credit. A higher platform rate can reflect broader click or view credit. Prefer a range and a note on how complete the measurement is. Labels such as poor, average, or excellent hide that distinction and push you to rebuild a page that was only counted differently.
Set Your Baseline and Start Your First Test
A baseline is the only honest control. Without two steady weeks on the current page, a new advertorial has nothing fair to beat, and every lift number is a guess.
- Record two weeks on the live page with one event, one denominator, and one window.
- Place that rate beside the ecommerce median and beside your own mobile and desktop split.
- Choose one variant, such as an advertorial matched to the ad's awareness stage, and keep the product page as the control. Landra's A/B testing guide shows how to keep that split from leaking.
- Set the window before launch, and do not read lift until each variant has cleared the conversion floor you committed to.
- Calculate CAC and lift together, then take the next action from the result pattern, including a flat result.
- Log every run with date, source, device split, and attribution window.
Our free Conversion Rate Calculator is where you run the baseline and the CAC check. A conversion-optimized page is built in 2 minutes, so the variant does not have to wait on a production queue while the control keeps spending. Robosize's ecommerce optimization guide is worth a pass before you touch offer or checkout, so the test stays about the page.
Open the calculator today, enter two weeks of the current page, and log the baseline rate before you scale anything.
Landra builds pre-sell landing pages, including advertorials and listicles, for DTC brands buying cold social traffic. You can check a page with the free Conversion Rate Calculator, then turn a product URL into an editable, mobile-first page and publish it to Shopify, a Landra URL, or HTML. When you want the rate, the acquisition cost, and the next test page in one place, start at Landra.