
Stop chasing the average ecommerce conversion rate. That's the most popular advice in this topic, and it's the least useful. A single blended percentage can't tell you whether your ad, landing page, product page, or checkout is losing buyers.
A rate is useful when you know its denominator, traffic mix, device mix, and funnel stage. Without those details, you're comparing your store to a composite of retailers who may sell different products to different people through different channels. Calculate your own stage rates first. Then use outside figures only as a matched comparison.
Table of Contents
- How to Calculate Ecommerce Conversion Rate
- Ecommerce Conversion Rate Benchmarks by Device and Source
- Why Shoppers Leave Before They Pay
- Finding Where Your Funnel Leaks
- Levers That Raise Conversion Rate by Stage
- Case Examples of Conversion Changes on Paid Traffic
- Run One Matched Test Before Changing Your Pages
How to Calculate Ecommerce Conversion Rate
The core formula is simple. Ecommerce conversion rate = orders divided by sessions, multiplied by 100. If a store records 150 orders from 6,000 sessions, the result is 2.5%.
Think of a storefront as a funnel. Visits pour in at the top, and only some become orders. The rate tells you what share of visits finished as purchases, not how well each individual page performed.
Four Variants You Should Track Separately
| Metric | Formula | Best used for | Worked example |
|---|---|---|---|
| Session conversion rate | Orders ÷ sessions × 100 | Overall storefront health | 150 ÷ 6,000 = 2.5% |
| User conversion rate | Buyers ÷ unique visitors × 100 | Audiences that return to buy | 150 ÷ 4,800 = 3.13% |
| Add-to-cart rate | Add-to-cart sessions ÷ sessions × 100 | Product page interest | 1,200 ÷ 6,000 = 20% |
| Checkout completion rate | Orders ÷ checkout starts × 100 | Checkout friction | 150 ÷ 300 = 50% |
The worked examples use illustrative sample data: 6,000 sessions, 4,800 unique visitors, 1,200 add-to-cart sessions, 300 checkout starts and 150 orders. Notice how the answer changes when the denominator changes. Session and user rates describe the same store, but they don't answer the same question.
That's why reports must use the same definition and time window. If one dashboard counts sessions, another counts users, and a third excludes returning visitors, you don't have a trend. You've got three incompatible measurements.
Cart abandonment is related, but it isn't your sitewide rate. Baymard Institute's long-running checkout research places documented online shopping-cart abandonment at approximately 70.19%, meaning roughly 7 out of every 10 shoppers who add an item to a cart don't complete the transaction. That measures the final purchasing stage after intent is clear, while sitewide conversion measures orders across all sessions or users.
Before comparing any two periods, run three checks in your analytics:
- Confirm the denominator: State whether you're dividing by sessions, users, checkout starts, or visitors.
- Match the date range: Pull orders and traffic for the same days, including the same timezone and attribution settings.
- Clean the traffic: Remove bot visits, internal team sessions, and test orders before calculating the rate.
Write the formula next to the number in every report. A percentage without its denominator can't be audited.
Ecommerce Conversion Rate Benchmarks by Device and Source
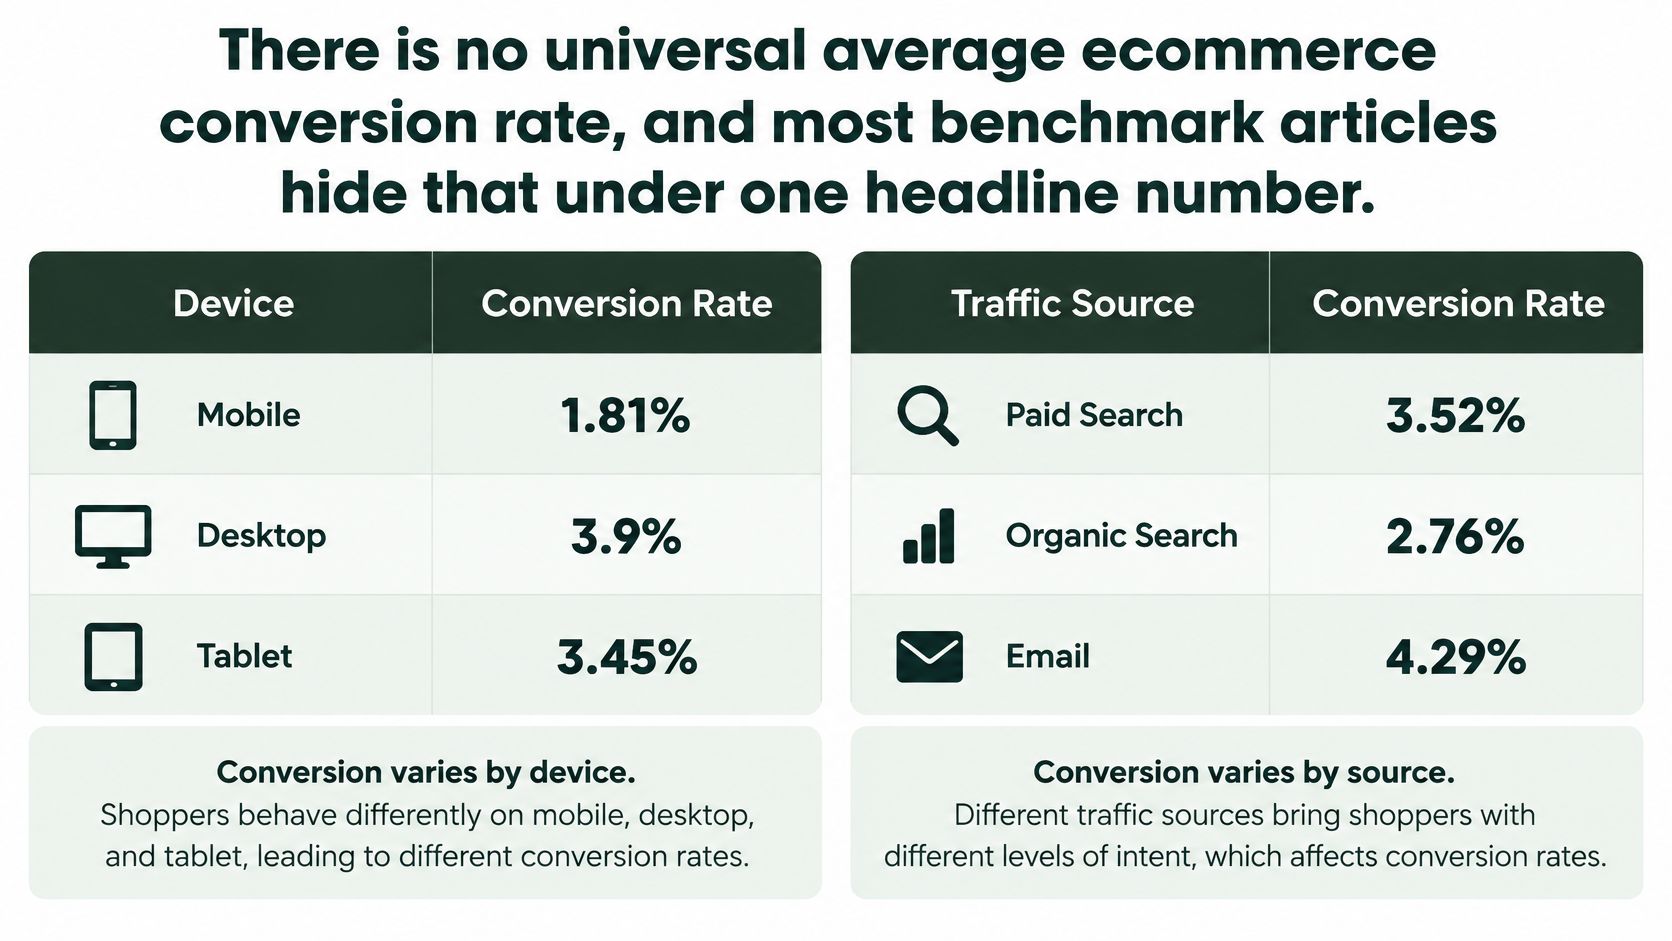
There's no universal average ecommerce conversion rate. Most benchmark articles hide that problem under one headline number, then present it as if every store should aim there.
The published panels disagree because they're not measuring identical populations. One panel shows desktop ahead, another shows near parity, and another puts mobile first.
The chart below sets out why device and source must be read together rather than as a single storewide average.
What Three Published Panels Actually Show
| Source | Desktop | Mobile | Panel and measurement note |
|---|---|---|---|
| Contentsquare | 3.4% | 2.0% | Large panel; mobile trails desktop |
| Littledata (Shopify sample) | 1.5% | 1.6% | Shopify stores; mobile slightly ahead |
| Dynamic Yield (enterprise panel) | 2.23% | 2.86% | Enterprise retailers; mobile leads desktop |
| Recent benchmark coverage | Not reported separately | Not reported separately | Overall rate reported around 2.5% to 3%; device split not stated |
a comparison of these benchmark panels reports Contentsquare with desktop converting at 3.4% versus mobile at 2.0%, Littledata's Shopify sample with mobile at 1.6% and desktop at 1.5%, and Dynamic Yield's enterprise panel with mobile at 2.86% versus desktop at 2.23%. You can't average those results into a target without erasing the reason they differ.
Retailer mix matters. A panel weighted toward enterprise brands, repeat buyers, or low-consideration products won't behave like a sample of smaller Shopify stores buying cold traffic. Geography matters too, because delivery norms, payment habits, and device use differ by market.
Measurement choices can move the result just as much. Counting all sessions produces a different rate from counting engaged sessions. Session definitions, attribution windows, and rules for cross-device visits can also shift orders between mobile and desktop. A shopper may research on a phone and buy on a laptop, leaving mobile looking weak even when the mobile visit started the purchase journey.
Pick the Comparison Group That Matches Your Traffic
Start with your own segments instead of a generic target. Split the rate by device, country, new versus returning visitor, paid social versus branded search, landing page, product category, and funnel stage. Record sample size and time window beside each figure.
A mobile rate below desktop isn't automatically a page failure. Mobile can be nearly equal to desktop, or higher, when traffic intent and audience mix differ. Cold paid social visitors arriving from a phone shouldn't be judged against returning desktop visitors who searched for your brand name.
For another view of how channel and device mix shape targets, understanding ecommerce conversion performance is a useful companion read. Pair it with Landra's DTC conversion benchmark guide when you're translating broad figures into DTC landing page decisions.
Build your benchmark from the last 90 days of segmented store data this week. Keep the sample size visible, separate branded demand from cold prospecting, and compare each segment with its own prior period before you compare it with anyone else's store.
Why Shoppers Leave Before They Pay
Checkout works like a series of toll gates. Each unexpected cost or extra step gives the shopper another chance to stop, even after they've added an item and signalled real intent.
The infographic below maps those gates to the reasons shoppers most often give for leaving.
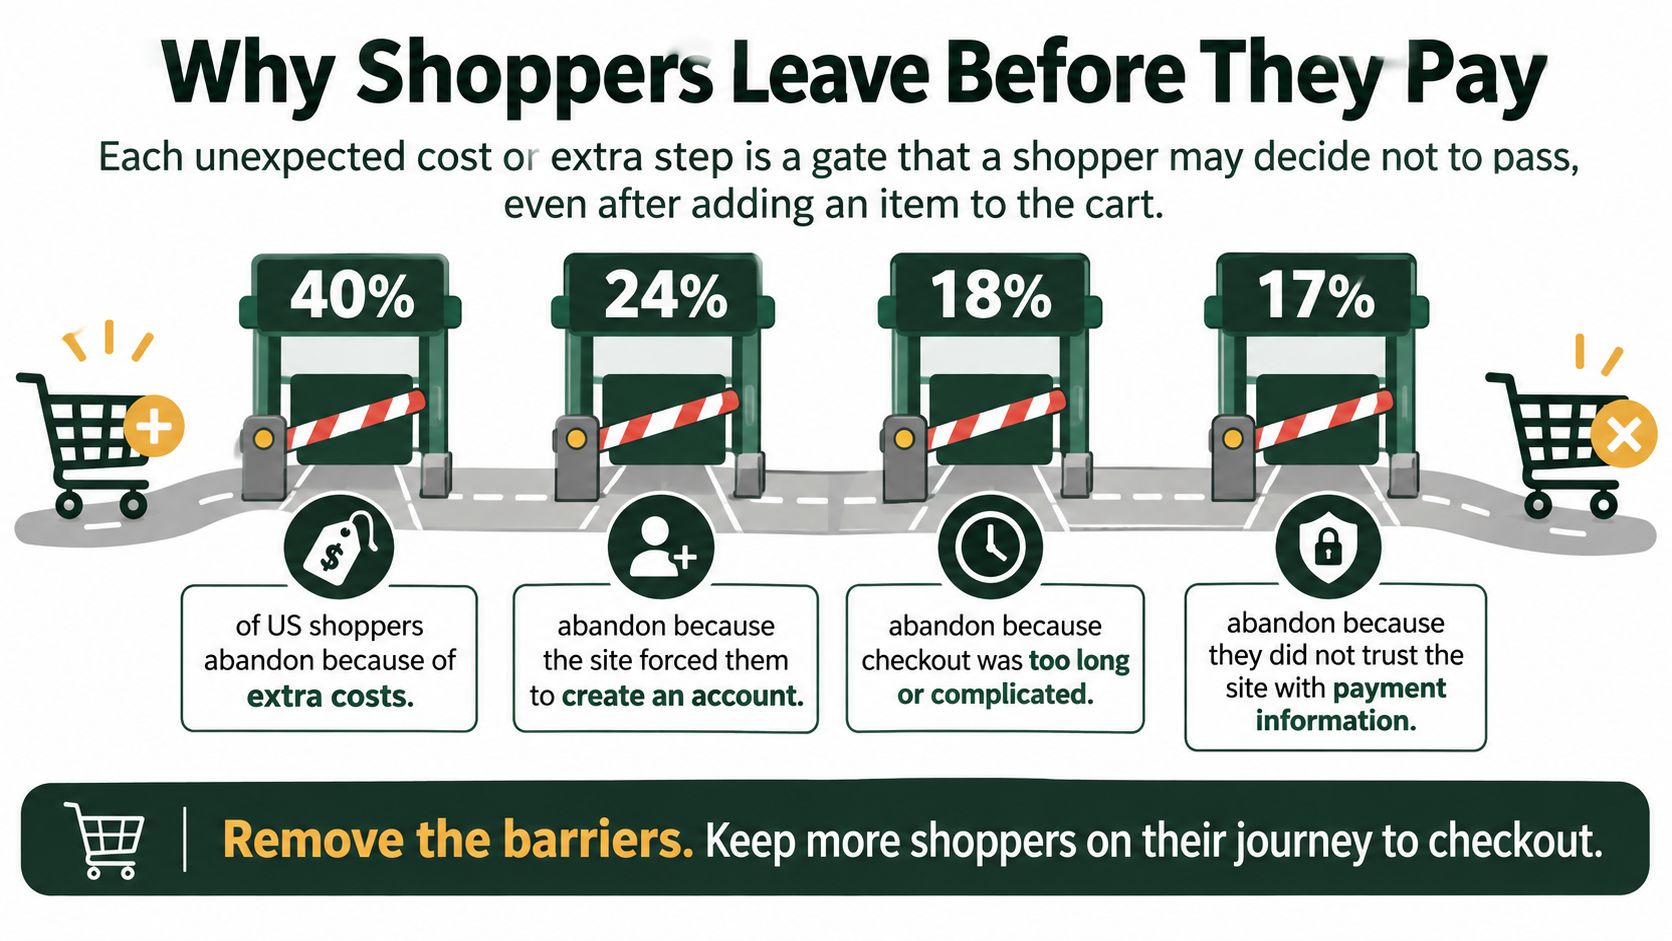
Baymard's summary of US shopper abandonment reasons reports that 40% of surveyed US shoppers abandoned checkout because extra costs, such as shipping, taxes, or fees, were too high. Another 17% cited a checkout process that was too long or complicated, while 18% abandoned because the site required account creation.
These percentages overlap. One shopper can select several reasons, so you shouldn't add them together or treat them as separate shares of lost orders. They identify friction themes. Your analytics still need to show which theme appears in your checkout and where people stop.
A Friction Audit You Can Run in Analytics
- Costs revealed late: Compare progress before and after shipping and tax totals appear. A sharp fall after the total price is shown points to price surprise, not weak product demand.
- Forced registration: Compare checkout completion for guests versus account holders. If account creation is mandatory, watch exits on the registration step and returns after password errors.
- Unclear delivery dates: Segment completion by delivery option and look for exits after shipping choices appear. Vague ranges can hurt you most when the product is a gift or replenishment item.
- Limited payment options: Review checkout exits by device and payment step. Mobile shoppers may leave when they must type full card details instead of using a saved wallet.
- Confusing error messages: Track repeated form submissions, field corrections, and exits after validation errors. Session replays can show whether shoppers understand which field failed.
Don't treat every abandonment as a persuasion problem. A shopper who reaches the payment step usually doesn't need another benefit claim. They need a clearer total, a delivery promise they can plan around, or a shorter route to pay.
Map each friction type to the exact stage where shoppers quit. That's the most direct way to fix drop-offs before payment without redesigning pages that are already doing their job.
Finding Where Your Funnel Leaks
A single sitewide rate hides the stage that is costing you orders. Break it into three ratios: ad click to engaged landing visit, landing visit to checkout start, and checkout start to purchase. Multiply those three rates together and you get the blended figure. That arithmetic matters because two stores can post the same 2.5% conversion rate for opposite reasons. One has strong landing engagement and a broken checkout. The other buys low-intent traffic that never reaches checkout.
The diagram below shows those drop off points between the ad click and the completed purchase.
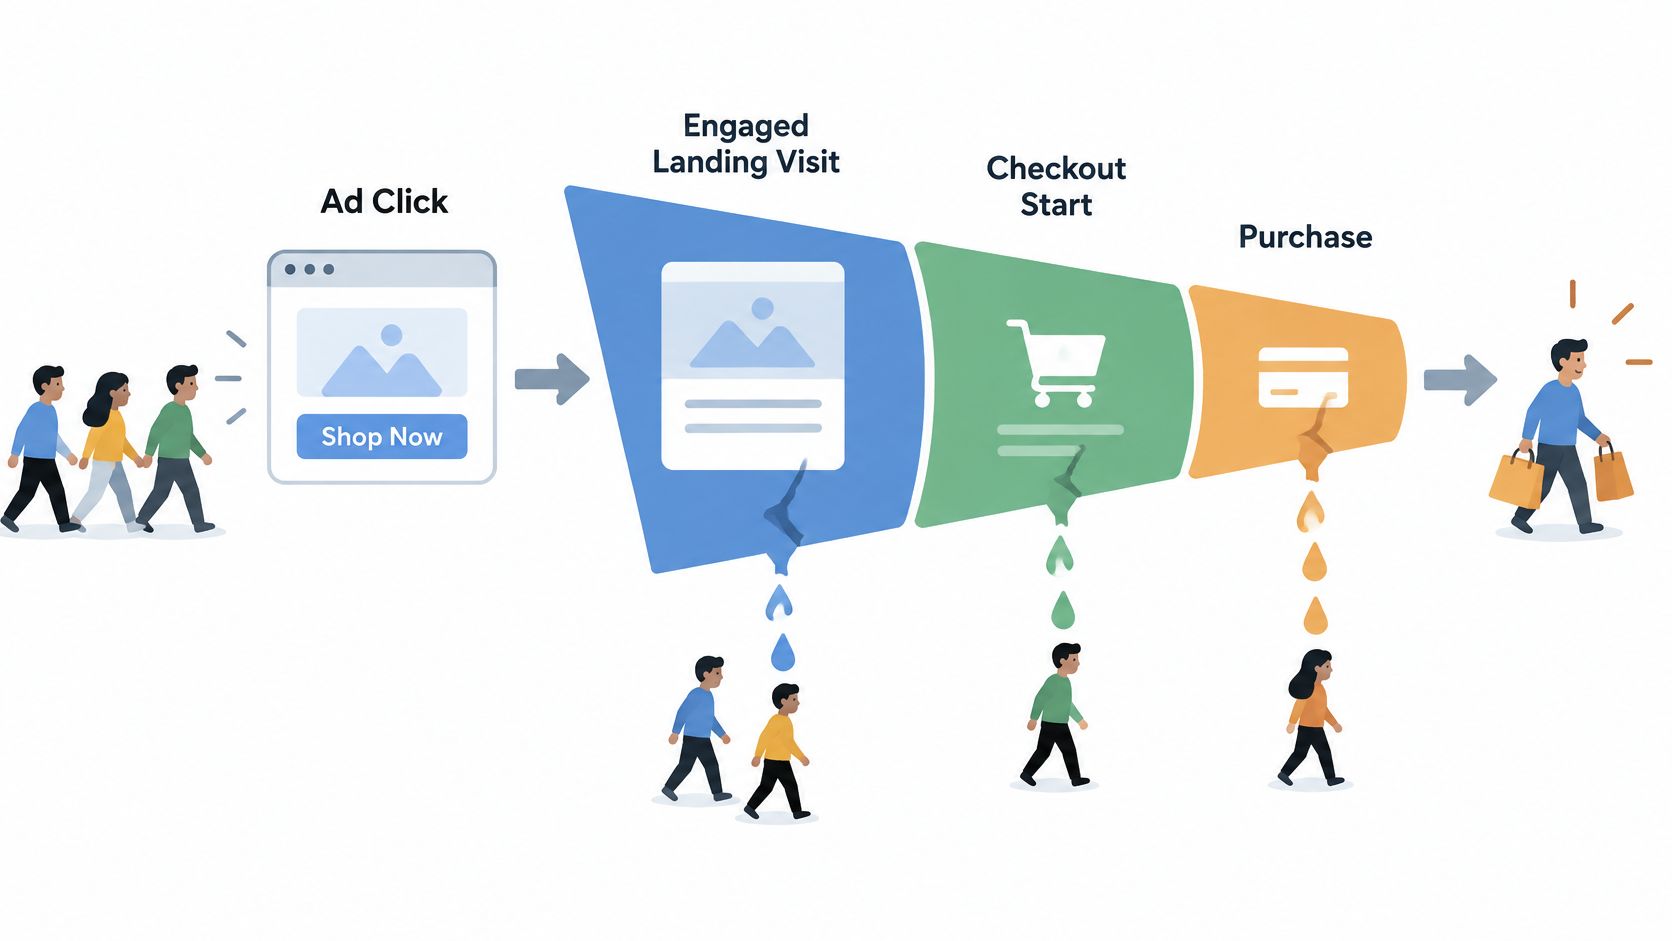
Recent benchmark coverage summarised by Woosmap places overall ecommerce conversion around 2.5% to 3%, but reports checkout completion at roughly 65% to 70% once shoppers begin checkout. Checkout completion varies widely between stores, so use that range as a reference point rather than a target. A store below the range has a checkout problem worth isolating before anything else.
Match the Weak Stage to Its Likely Cause
| Funnel stage | Metric to check | Weak signal | Likely cause |
|---|---|---|---|
| Ad click to landing visit | Engaged visit rate | Most visitors leave in seconds | Ad promise and page headline do not match |
| Landing visit to checkout start | Checkout start rate | Engaged visitors rarely start checkout | Offer unclear, product not understood, or traffic low-intent |
| Checkout start to purchase | Checkout completion rate | Starts occur but orders lag | Price surprises, delivery doubts, payment gaps or form friction |
A weak first stage usually means the visitor did not see what the ad promised, the page loaded poorly, or the campaign is buying curiosity rather than purchase intent. Check the landing experience by campaign and creative before you rewrite the entire page.
A weak middle stage points elsewhere. Visitors stayed long enough to engage, but they did not understand the product, trust the claim, or see why the offer was worth the price. Clearer education, proof near the claim, and a plain explanation of delivery or returns can move that rate.
A weak final stage moves suspicion away from persuasion. People already started checkout, so look at total price clarity, delivery expectations, payment options, trust cues, and form usability. Fix the step where exits cluster. More cold traffic into a checkout that is already failing mainly buys more abandoned checkouts.
The video below walks through how to read these stages together before choosing a fix.
Use this decision rule. If a presell page raises checkout starts but completion stays weak, the presell page is not the problem. It created more qualified intent, and your checkout failed to finish the job. The reverse also holds: a high checkout completion rate on a tiny number of starts is not proof your funnel is healthy. Check the denominator before celebrating.
Segment all three rates by new versus returning visitor and by mobile web versus desktop. Then calculate them for your top paid campaign before changing any page. Use a long enough window to collect a meaningful number of checkout starts, because a completion rate built on a handful of starts will swing for reasons unrelated to your page. With those three numbers in front of you, you can tell whether you are repairing traffic quality, product understanding, or checkout friction.
Levers That Raise Conversion Rate by Stage
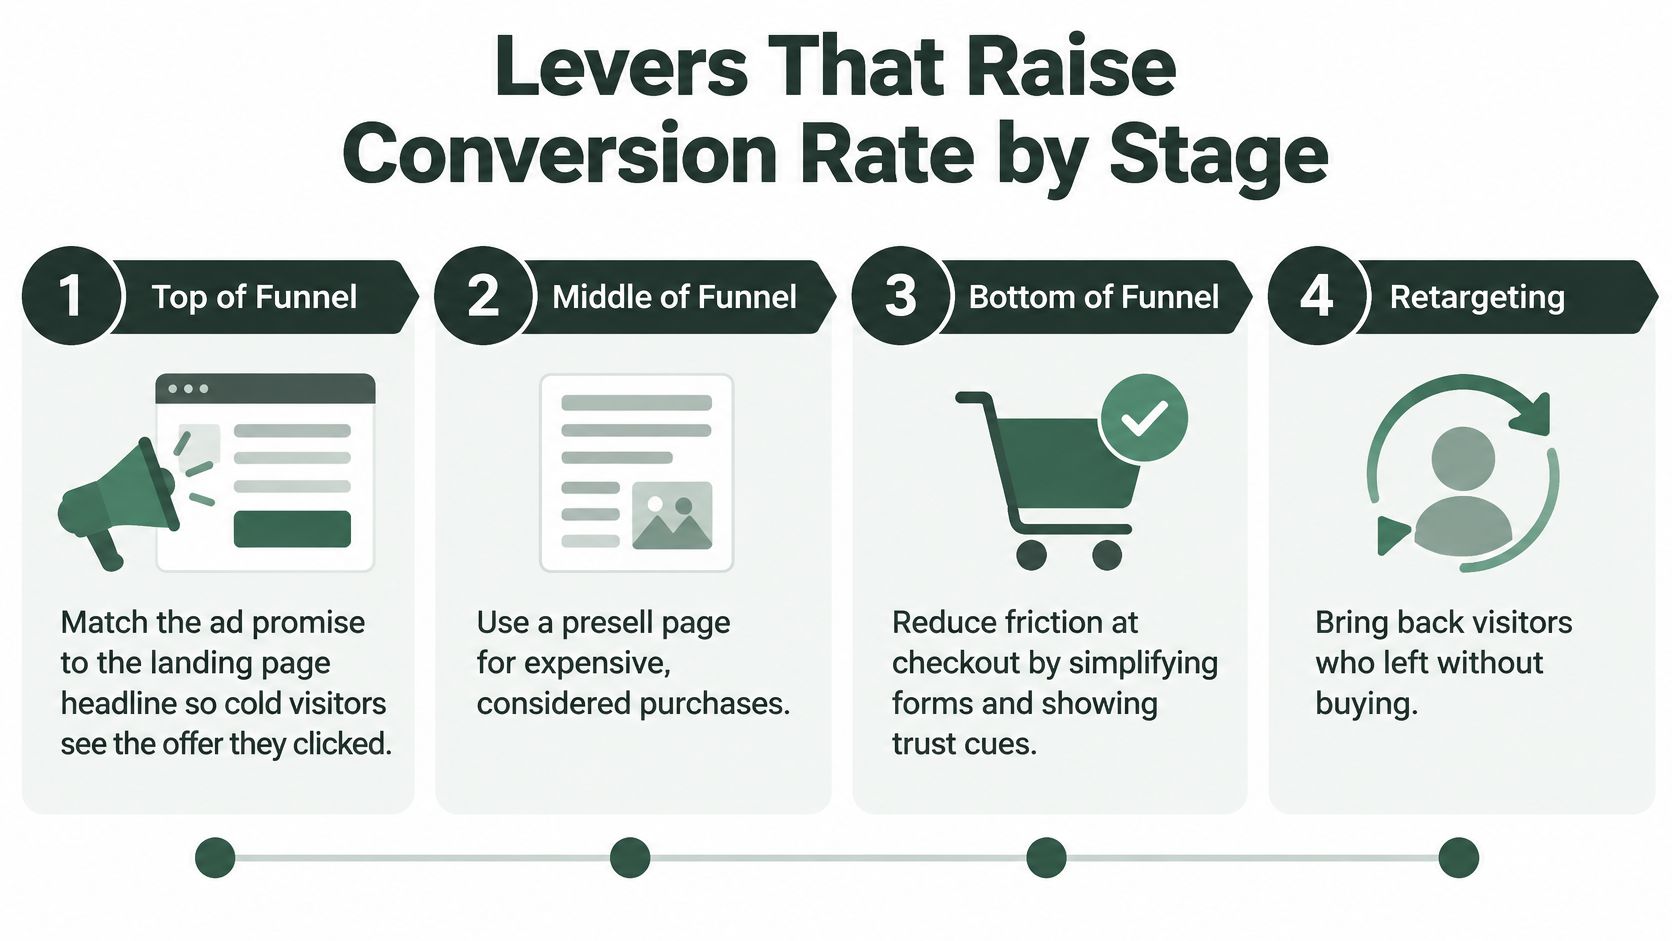
Work from the top of the funnel down, but fix the weakest stage first. Each lever below has one concrete test so you can tell whether it changed completed purchases, not just clicks.
The diagram below orders the main levers by funnel stage.
Top of the Funnel
- Match the promise: Put the ad's main claim, product, and offer in the landing page headline and first screen. Test one matched headline against your generic product headline so cold visitors immediately see they clicked into the right place.
- Protect mobile attention: Test a faster, lighter landing page on paid social traffic. Remove heavy sliders, compress hero images, and keep the primary action visible without forcing visitors through navigation.
- Qualify before the product page: For expensive, considered, or heavily contested products, test a presell page that explains the problem, mechanism, proof, and tradeoffs before asking for a purchase. For impulse or low price products, test sending traffic straight to the product page.
Cold visitors haven't granted you patience yet. A presell page earns attention by reducing uncertainty, but it can't rescue an unclear offer or a broken checkout later. Judge it by downstream purchases and customer acquisition cost.
Middle of the Funnel
Show the total cost early, including a shipping and tax estimate where you can. Put delivery timing, returns, guarantees, and key product limits beside the buy action instead of burying them in policy pages. Then test whether checkout starts rise among engaged visitors.
Product imagery should answer fit, scale, and use questions, not just look polished. For apparel and wearable products, on-model imagery with Picjam can help you test clearer fit presentation without waiting for a full shoot. Measure add-to-cart and checkout starts after the change, because attractive images don't prove shoppers understood the product.
Social proof works best when it's close to the claim it supports. Place the relevant review, result, or credential near the statement a sceptical shopper is evaluating. A block of generic praise at the bottom of the page asks visitors to do the connecting work for you.
Bottom of the Funnel
Baymard's cart abandonment benchmark identifies an ideal flow of roughly 12 to 14 total form elements, while the average U.S. checkout displays 23.48 elements by default. Baymard indicates many sites can reduce default form elements by 20% to 60% through progressive disclosure and better defaults.
Count what shoppers see, not only what your database requires. Optional promotion inputs, duplicated address fields, account creation, shipping selectors, and validation steps all add perceived effort. A technically short form can still feel long when every field demands attention at once.
Run these checkout tests one at a time:
- Guest checkout by default: Let shoppers pay first and offer account creation after the order.
- Autocomplete and inline validation: Use browser and address autocomplete, then show errors beside the field while the shopper can still fix them easily.
- Remove nonessential fields: Cut fields that don't affect fulfilment, payment, fraud checks, or legal requirements.
- Hide the coupon field: Reveal optional coupon entry only when requested, so shoppers without a code don't leave to search for one.
- Cover common payment methods: Offer the wallets and payment choices your device and country segments already prefer.
Record field level abandonment and judge mobile separately from desktop. A checkout that feels manageable with a keyboard can become tedious on a phone, especially when address entry, account creation, and card typing all arrive together.
Testing rule: Change one lever in one stage per experiment, then judge it by completed purchases and cost per acquisition. Click-through rate can't veto a downstream loss.
Case Examples of Conversion Changes on Paid Traffic
Cases are useful only when they name what changed, what was measured, and which metric decided the outcome. A higher click rate by itself doesn't prove a better page.
The Advertorial Test Judged by Acquisition Cost
In a single vendor reported test, the same ads were routed to an advertorial instead of the product page, and customer acquisition cost fell 46%. The important detail is the decision metric. The page wasn't declared a winner because more people clicked through. It won because the ad platform acquired customers at a lower cost.
Before copying that result, verify that both pages sell the same product at the same price and receive matched traffic. Also check completed orders, refund behaviour, and contribution margin. A cheaper first purchase can still be a poor outcome if the page oversells and returns erase the gain.
The Expensive Product Sent Straight to a Product Page
This second case is illustrative. Say a shopper taps a paid social ad for a $140 skincare device and lands on a clean product page with a price, shade selector, and add-to-cart button. The page is tidy, loads quickly, and asks for a purchase within seconds.
She leaves because the order of persuasion is wrong. She hasn't learned what the device does, how often she'd use it, what evidence supports the claim, or why it costs more than familiar alternatives. The measured problem wouldn't be checkout design. It would be a weak landing visit to checkout start rate among engaged visitors.
A presell page is a reasonable test here because the product is considered and education dependent. Verify success by checkout starts, completed purchases, and cost per acquisition from the same audience. Don't stop at time on page, which can rise when people are interested or confused.
The Device Gap That Disappears
This third case is also illustrative, not a reported result. A store sees mobile trailing desktop and assumes its mobile landing page is broken. After segmenting by traffic source, the team finds desktop is dominated by branded search and returning visitors, while mobile carries most cold paid social clicks.
Once traffic is matched by intent and source, the device gap narrows or disappears. That doesn't prove the mobile experience is perfect. It proves the original comparison blamed the device for an audience mix problem.
Imagery can create the same false diagnosis. A fashion brand might test ai model outfit e-commerce presentation to clarify fit, but it should compare matched mobile and desktop cohorts before crediting the images. Otherwise a shift toward warmer traffic could look like a creative win.
A higher conversion rate matters only if cost per acquisition and contribution margin improve too.
Run One Matched Test Before Changing Your Pages
Don't redesign from a dashboard percentage. Run one matched test against the stage you've identified as weakest.
- Pull the three stage rates: Use the last 30 to 90 days, segmented by device and traffic source. Landra offers free tools including the Headline Analyzer, Conversion Rate Calculator and Compliance Checklist, which can help you keep the baseline calculation consistent.
- Name the weakest stage: Use the diagnosis table to choose one stage only. Don't split your attention across the ad, landing page, and checkout in the same experiment.
- Select one targeted lever: Match the change to that stage, such as a clearer headline for message mismatch or guest checkout for registration exits.
- Build a fair control and variant: Both pages must sell the same product at the same price. Send matched traffic to each and judge mobile and desktop separately.
- Wait for enough orders: As a working rule, don't decide before each variant has at least 100 orders and the test has covered at least one full weekly cycle. Record the time window with the result.
- Judge the business outcome: Use completed purchases and cost per acquisition, not click-through rate. Check contribution margin before scaling the winner.
This is the practical discipline behind testing landing pages for paid social. The test design matters as much as the page copy because unmatched audiences can manufacture a lift that disappears at scale.
No page can promise a fixed lift. Landra does not promise a set lift in conversion; it promises pages shipped. That distinction keeps the promise realistic. Your advantage comes from reaching a clean, measurable test faster, not from treating any template as a guarantee.
Write down the baseline numbers before changing anything. If you can't state the starting stage rate, denominator, segment, and time window, you won't have anything honest to compare the result against.
When your weakest stage needs a presell page, Landra can turn a product URL into an editable, mobile first advertorial or listicle you can publish and test against your current page. Bring your baseline stage rates, customer acquisition cost, and contribution margin to the test, and let completed purchases decide whether the new page earns more traffic.