
Conversion benchmarks are useful and dangerous in equal measure: useful because they tell you whether a page is winning or losing, dangerous because most quoted numbers measure something other than what you think. This is a verified roundup of DTC landing-page conversion benchmarks for 2026 — every figure with its source, its date, and what it actually measured. Where a stat couldn't be verified, it isn't here.
What's a realistic DTC conversion rate in 2026?
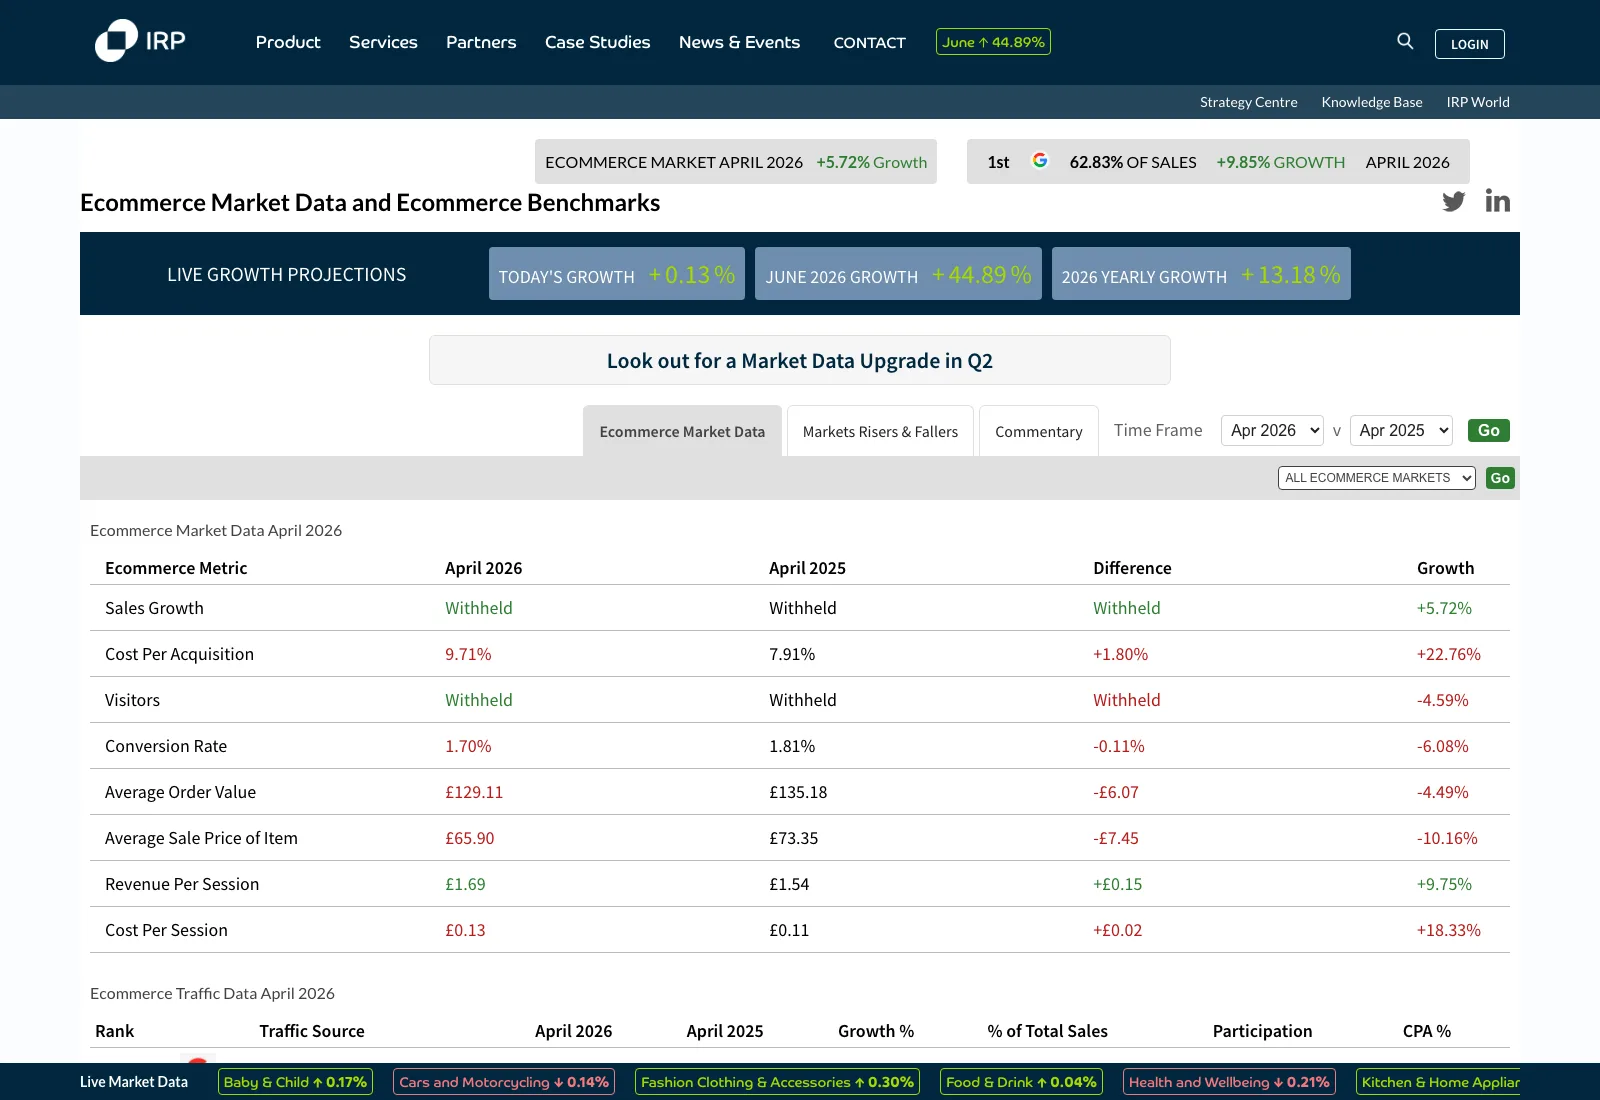
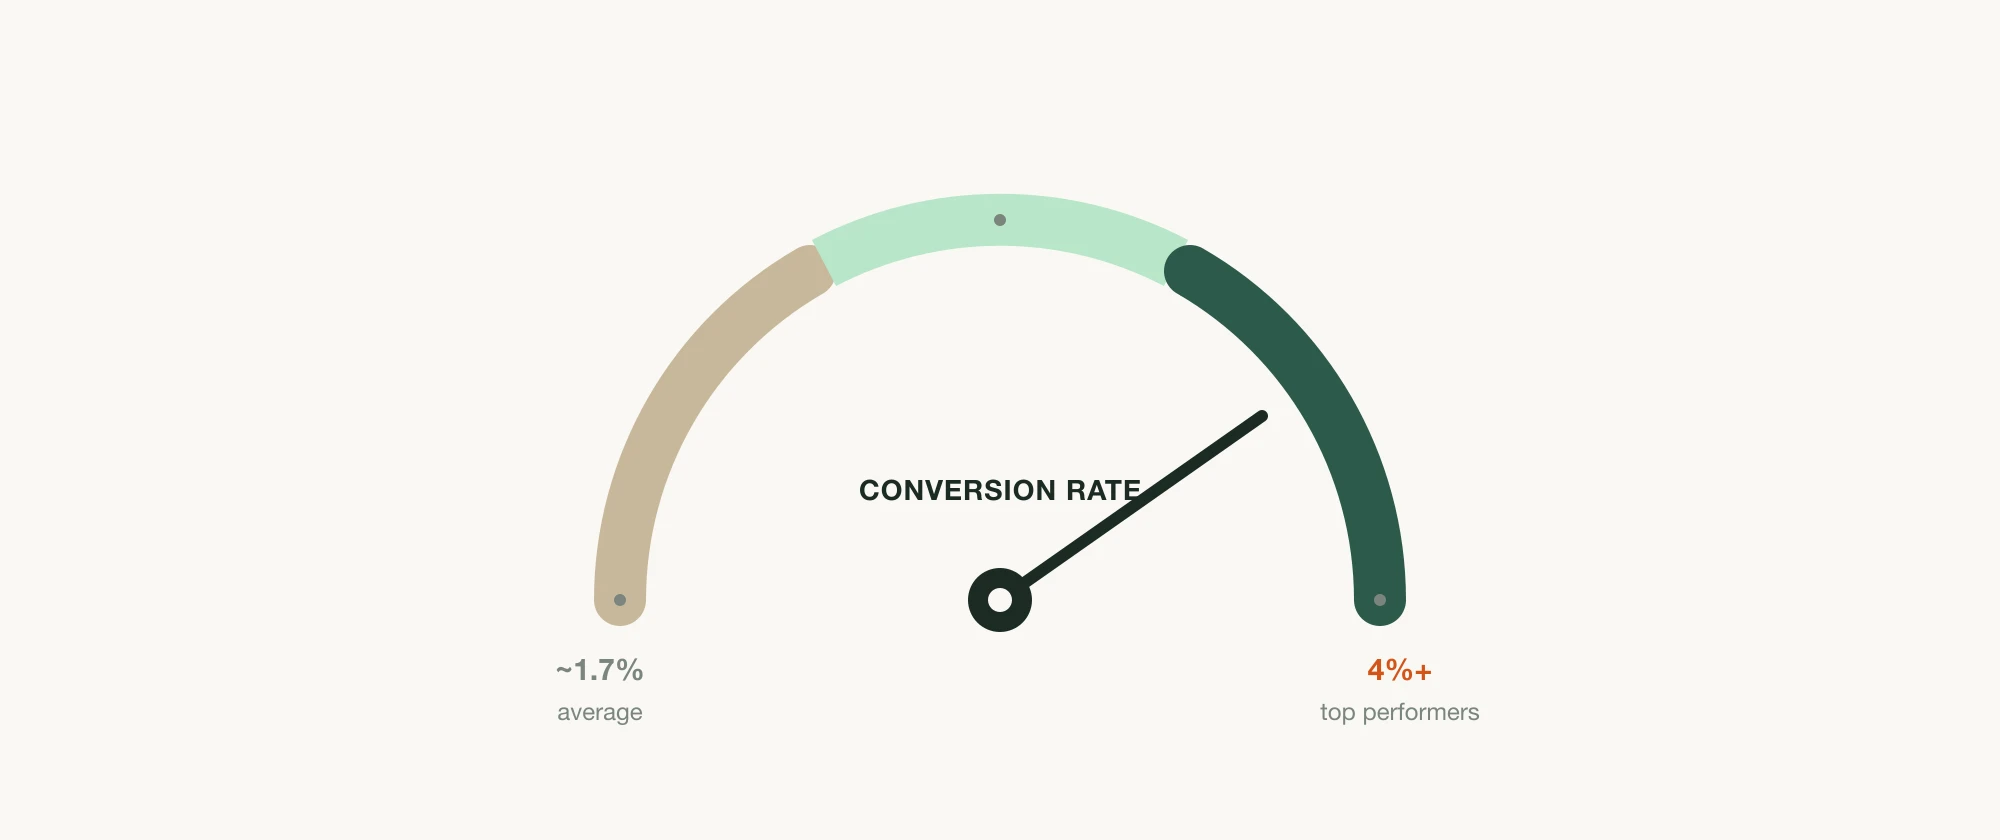
For ecommerce purchases, the real-world average sits around 1.7–2.7%, depending on the dataset — with top performers reaching 4–5% and above. Three independent-leaning sources converge on that range: IRP Commerce's live market data put the overall ecommerce conversion rate at 1.70% in April 2026 (IRP Commerce, real transaction data); Triple Whale reported a 2.01% median across 33,000+ brands (February 2026, vendor data); and Dynamic Yield's rolling benchmark across 400+ brands shows a 2.69% global average (undated, Mastercard-owned).
The single most important thing to know about benchmarks: the 6.6% figure you'll see everywhere is not an ecommerce purchase rate. It's Unbounce's all-industry median for landing-page conversions — form fills, signups, lead-gen actions — across every vertical including B2B and SaaS (Unbounce Conversion Benchmark Report, 2024 data, vendor). Unbounce's ecommerce-specific median is 4.2%, and even that counts landing-page actions, not just purchases. Always ask what action a benchmark measured before you compare your page to it.
Conversion rate by industry
Conversion rate varies several-fold by category, so "average" is only meaningful within your vertical. Consumable, lower-consideration categories convert highest; high-consideration and luxury categories convert lowest. Across Dynamic Yield's 400+ brand dataset (a continuously-updated rolling benchmark, which is why it carries no single publication date), Food & Beverage leads at ~5.5%, with Beauty & Personal Care around 4.3% and Pet Care ~4.1%, while Home & Furniture (~1.2%) and Luxury & Jewelry (~0.85%) sit at the bottom.
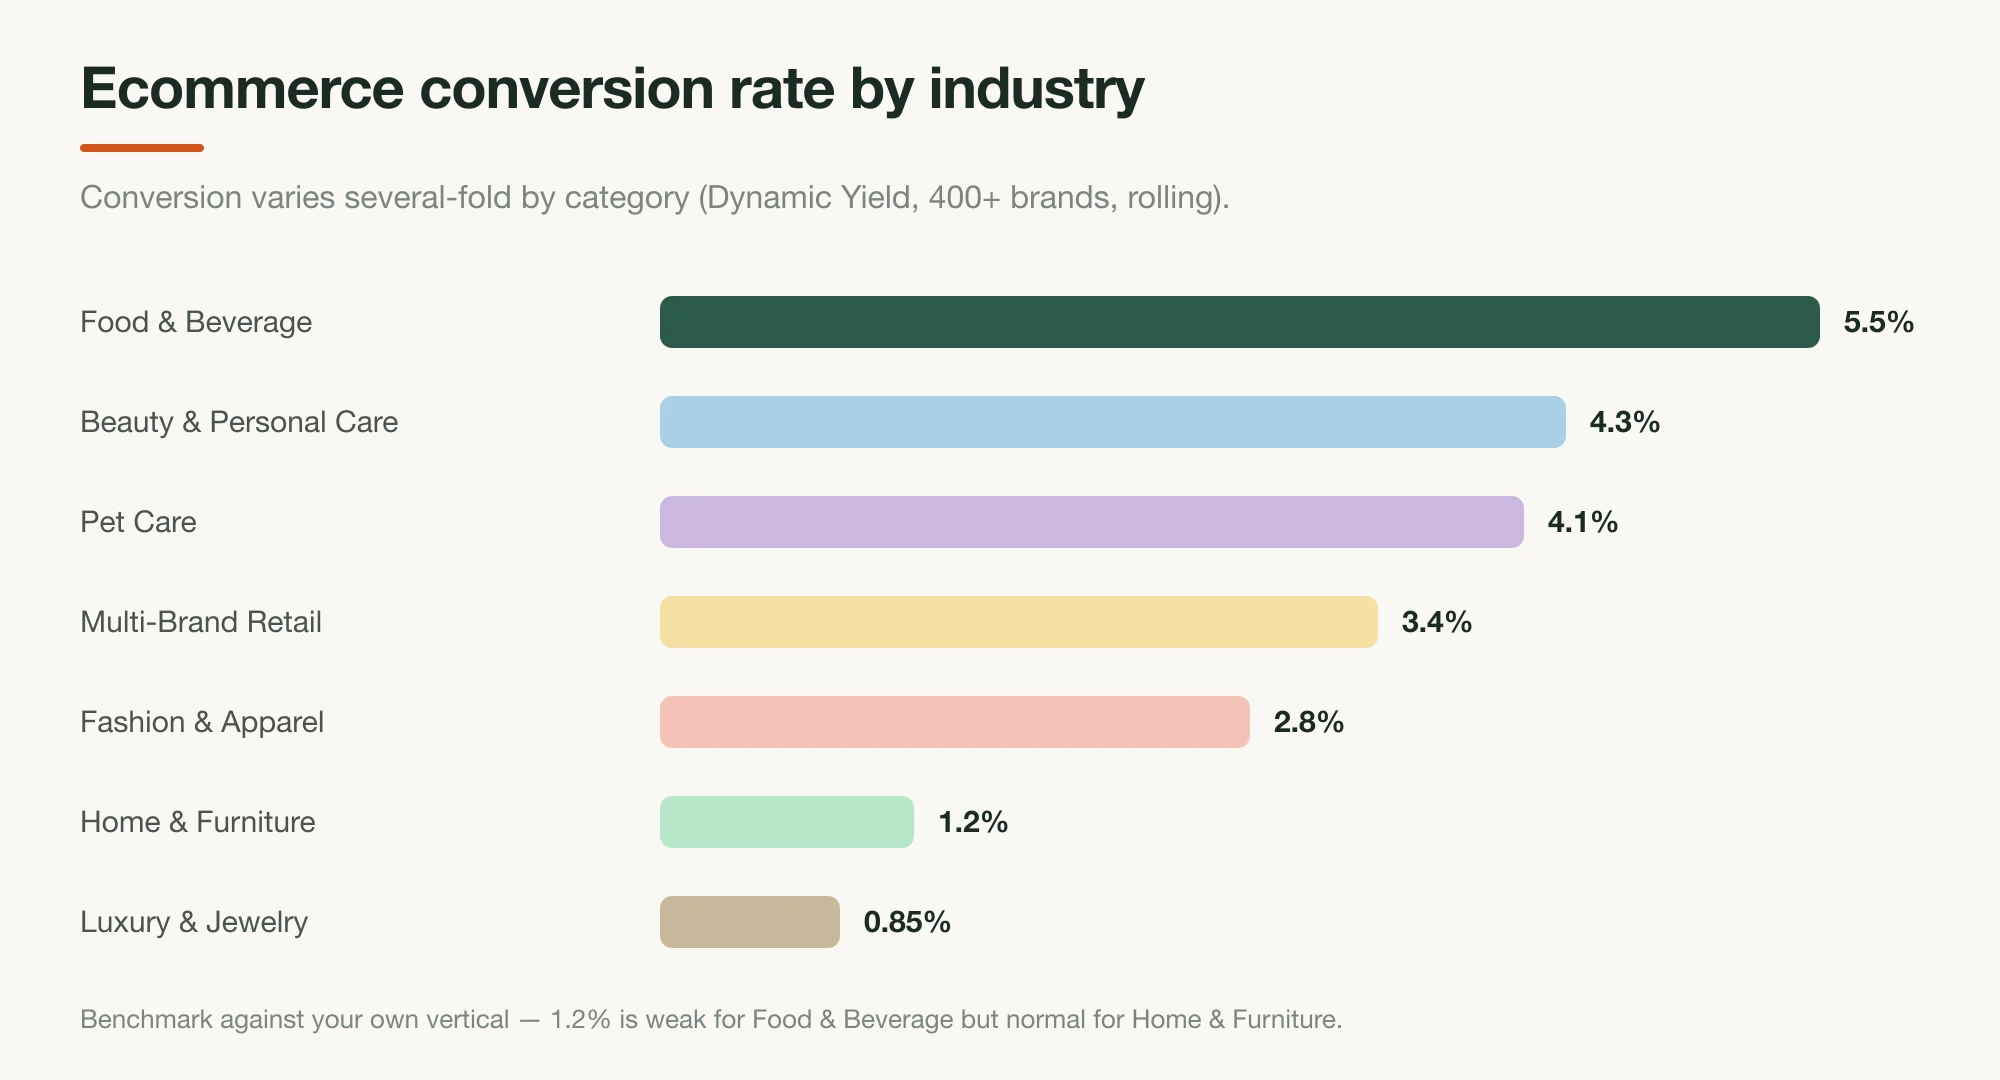
The takeaway isn't the exact decimals — vendor datasets differ — it's the spread. The same 1.2% conversion rate sits far below the chart's ~5.5% Food & Beverage figure but right at its ~1.2% Home & Furniture level — weak in one category, normal in another. Pull your category's number before you judge a page.
Conversion rate by traffic source
Traffic source moves conversion more than almost any on-page factor, because it determines how warm and how intent-loaded the visitor is. MHI Growth Engine's DTC benchmark (February 2026, practitioner data, no disclosed sample) lays out the spread, from warmest to coldest:
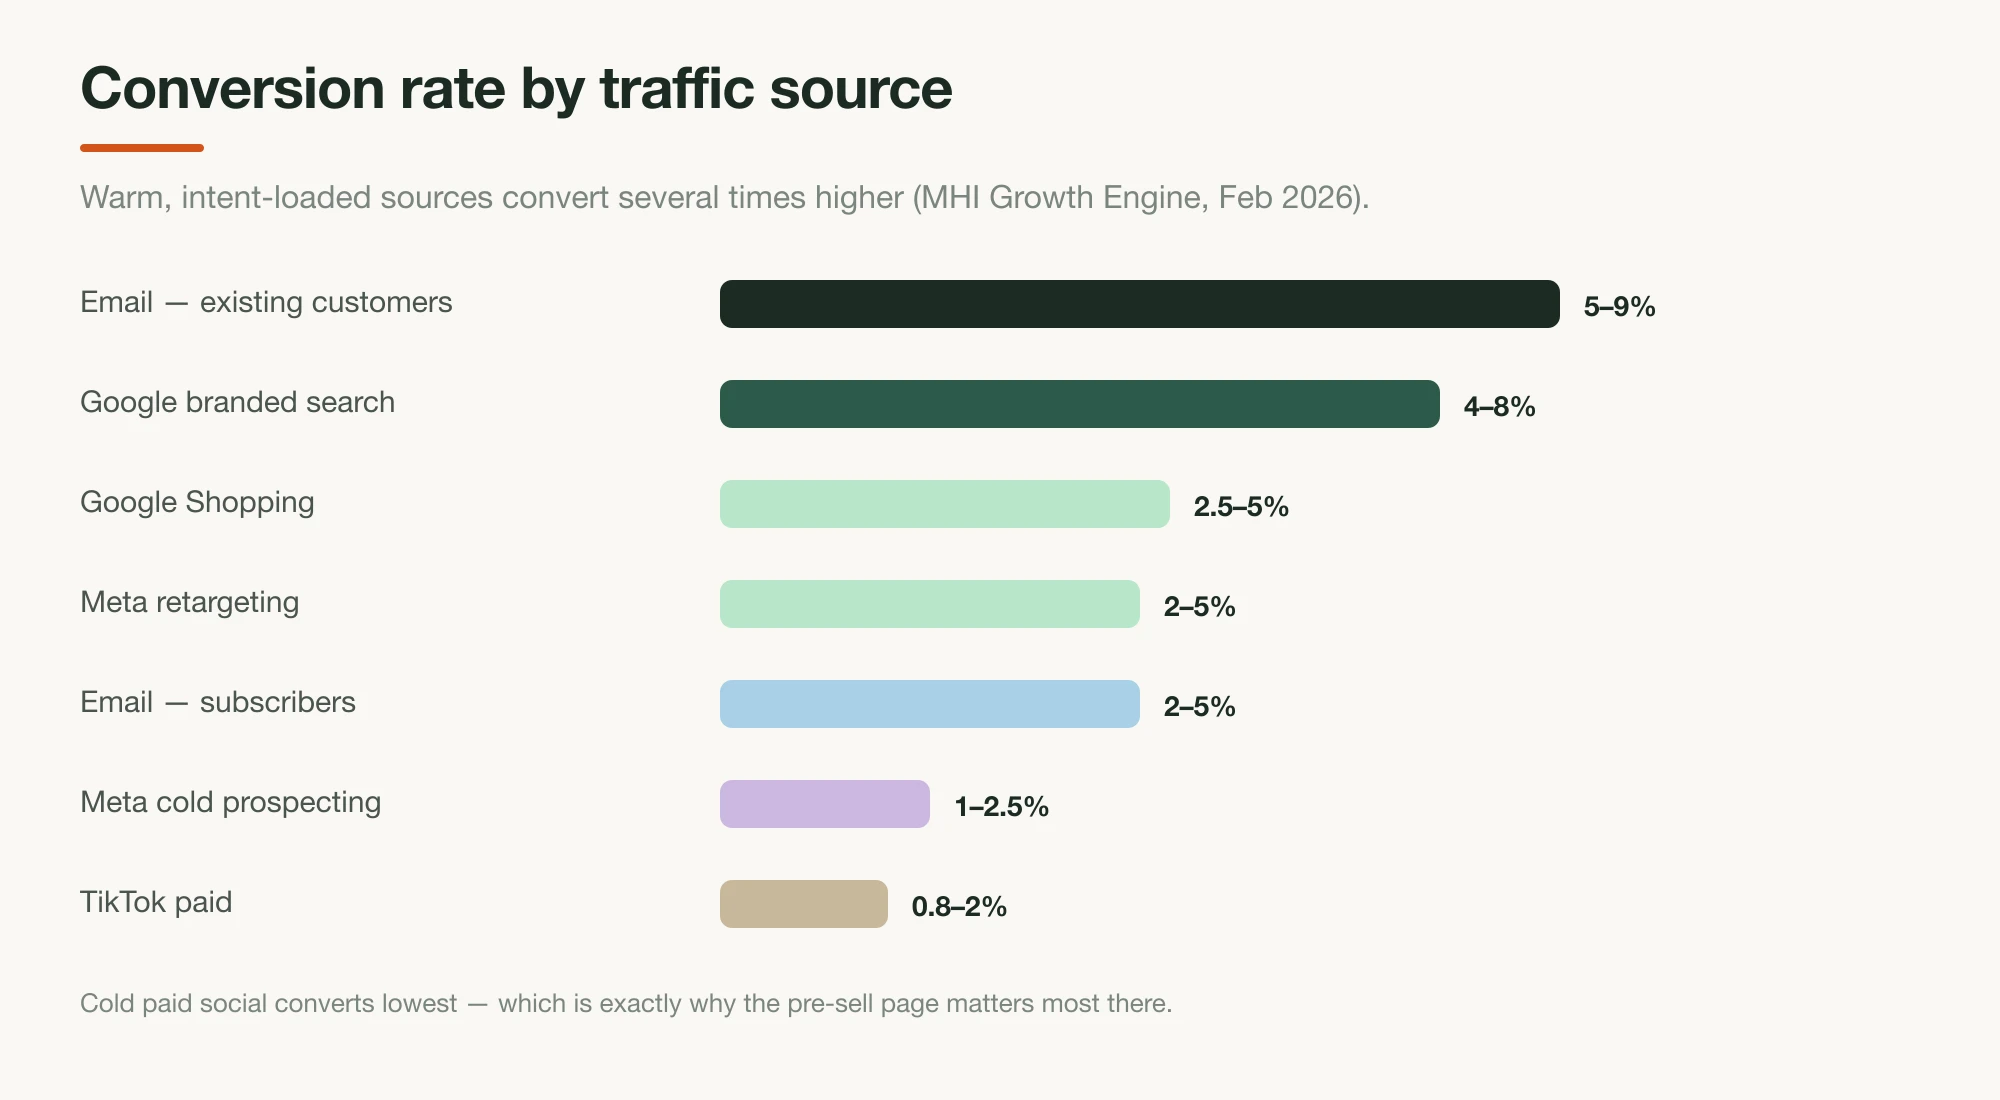
- Email to existing customers: ~5–9% average (10–15% top quartile)
- Google branded search: ~4–8% average (7–15% top quartile)
- Meta retargeting: ~2–5% average
- Google Shopping: ~2.5–5% average
- Email to non-customer subscribers: ~2–5% average
- Meta cold prospecting: ~1–2.5% average
- TikTok paid: ~0.8–2% average
The pattern is the whole point: cold paid social — the channel most DTC brands lean on for new-customer acquisition — converts lowest. That's not a reason to avoid it; it's the reason a pre-sell page matters most there. The page is what closes the gap between a cold click and a sale.
Conversion rate by page type
What you send paid traffic to changes the outcome. Sending a cold visitor straight to a product page asks them to buy before they're convinced; a dedicated landing page or an advertorial warms them first. MHI Growth Engine (February 2026) reports the following typical ranges for cold traffic: advertorial / editorial landing page ~2–5%, dedicated landing page ~2.5–5%, product page (PDP) ~1.5–3.5%, and quiz funnel ~3–8%.
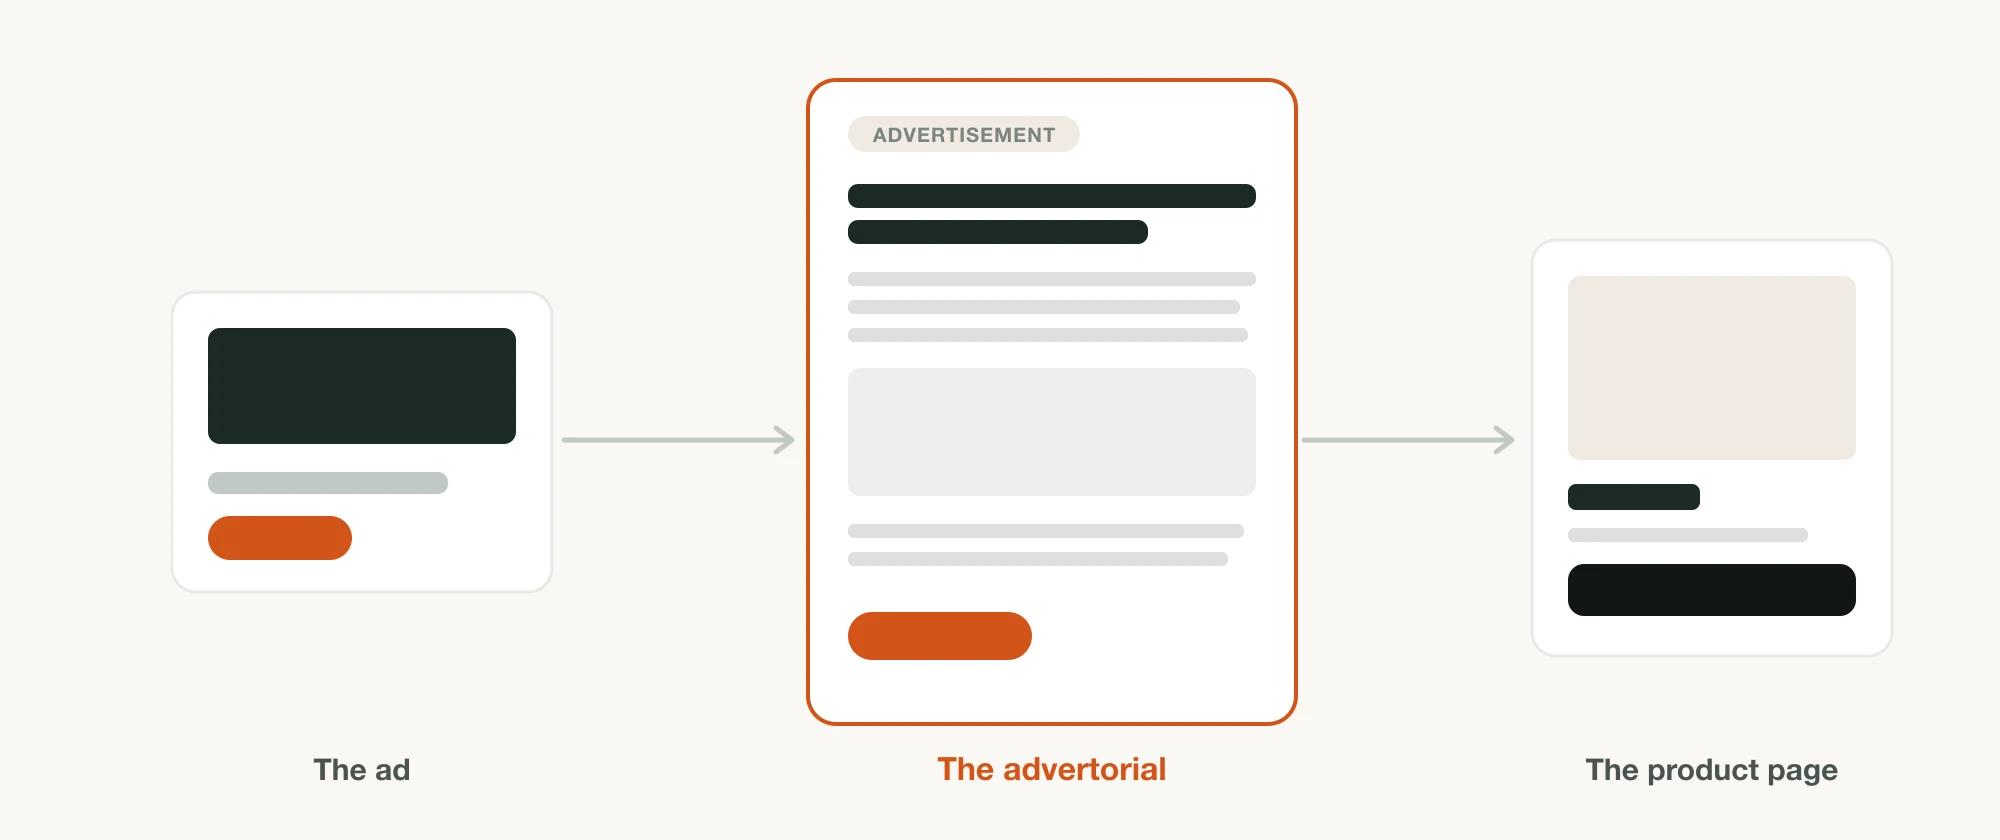
The advertorial advantage on cold traffic shows up in vendor estimates too: TrueProfit reports that sending Facebook traffic straight to a product page might convert "around 0.5%," while adding an advertorial in between "can jump to 3–5%" — a vendor figure, so read it as directional, but consistent with the page-type ranges above. None of these are controlled trials; they're practitioner benchmarks. The honest framing is that page type clearly matters, and the colder the traffic, the more it matters — which is the whole case for writing an advertorial instead of pointing ads at a product page.
Page speed and conversion
Speed is one of the few benchmarks with a clear causal story, and it's brutal on the margin. Portent's analysis of ecommerce sites found conversion rate fell from about 3.05% at a one-second load, to 1.68% at two seconds, to 1.12% at three seconds — a steep early drop (Portent, data last updated 2022; the study itself flags smaller samples at slower load times, so the cleanest comparison is the one-to-three-second range).
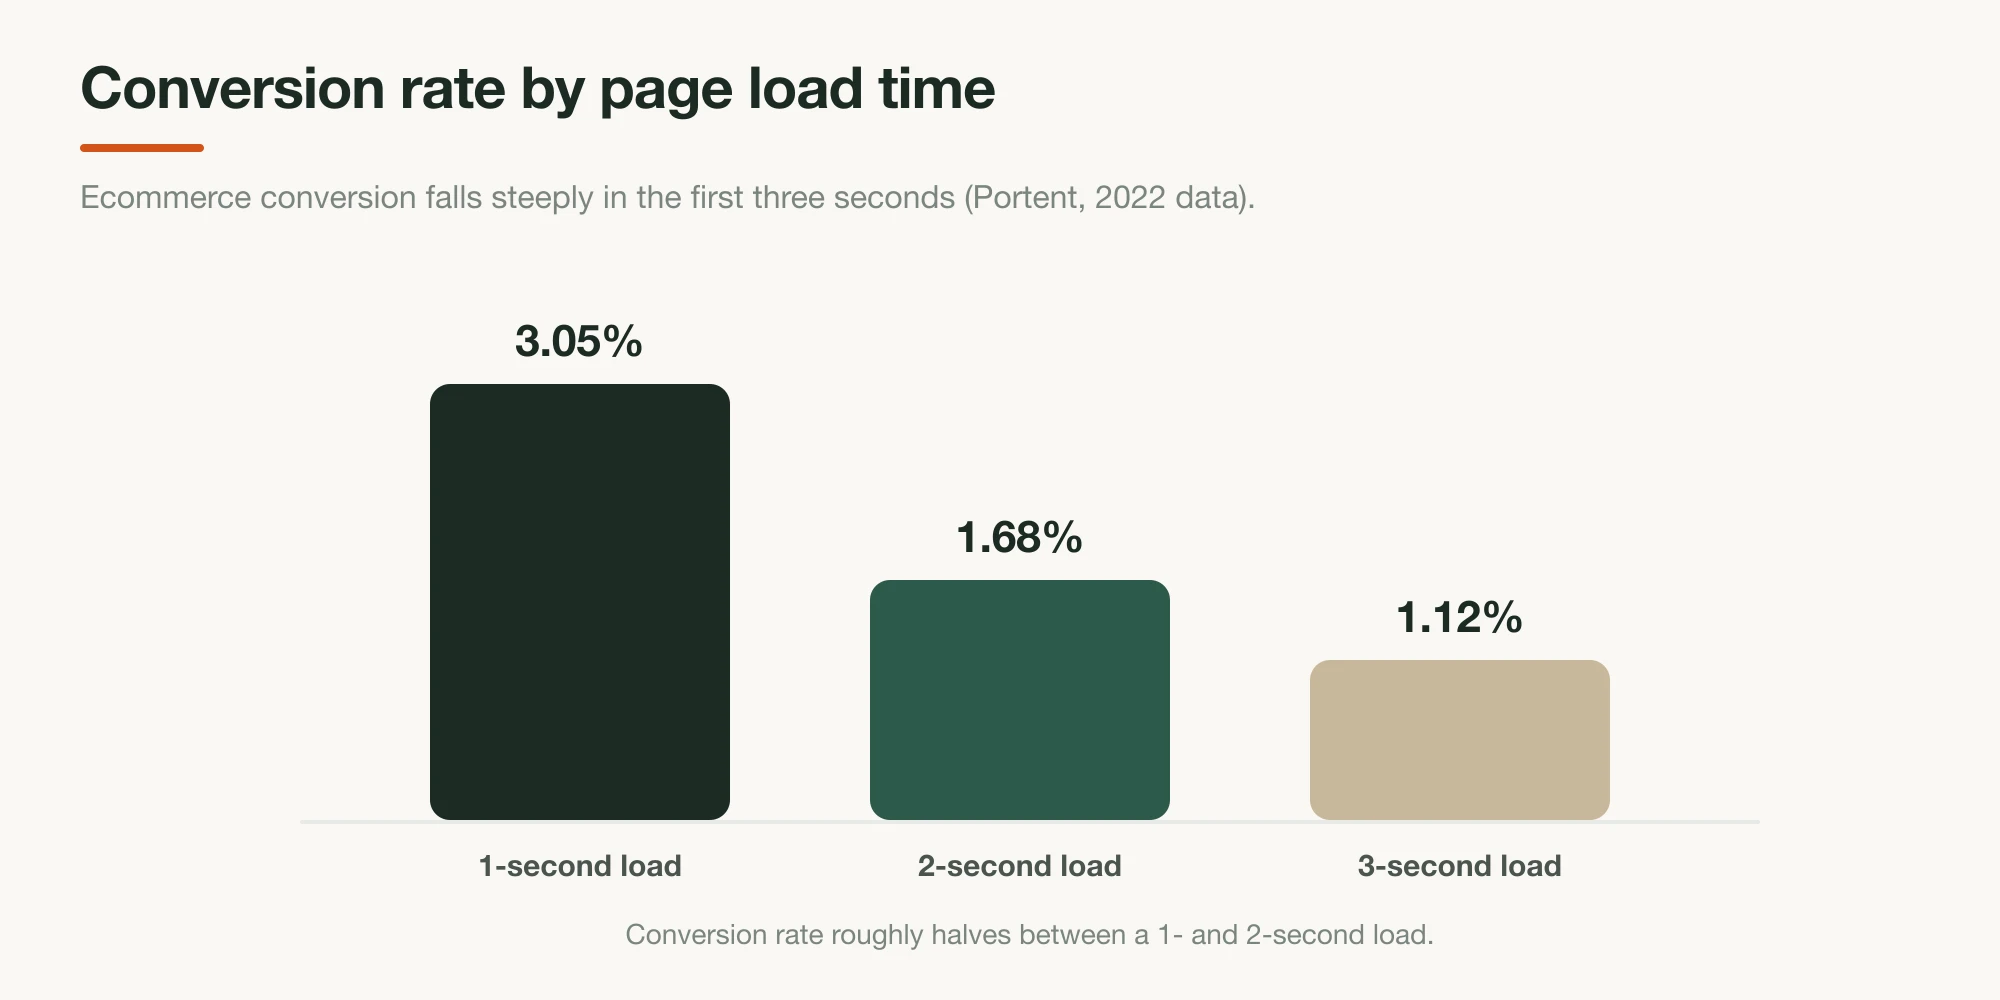
Independent corroboration comes from a Google-commissioned study, "Milliseconds Make Millions," which found that a 0.1-second improvement in mobile load time lifted retail conversion rates by 8.4% and average order value by 9.2% (web.dev, 2019 data, published 2020). The exact percentages are several years old and dataset-specific, but the direction is consistent and well-replicated: faster pages convert better, and the first few seconds carry most of the effect.
Mobile vs. desktop
Mobile dominates traffic but converts lower than desktop — the central tension in DTC measurement. Mobile drives the majority of visits (Triple Whale puts it around 73% of traffic; IRP Commerce attributes 62.4% of sales to mobile as of April 2026), yet desktop converts roughly twice as well: Triple Whale reports 3.9% on desktop versus 1.8% on mobile (February 2026, vendor data).
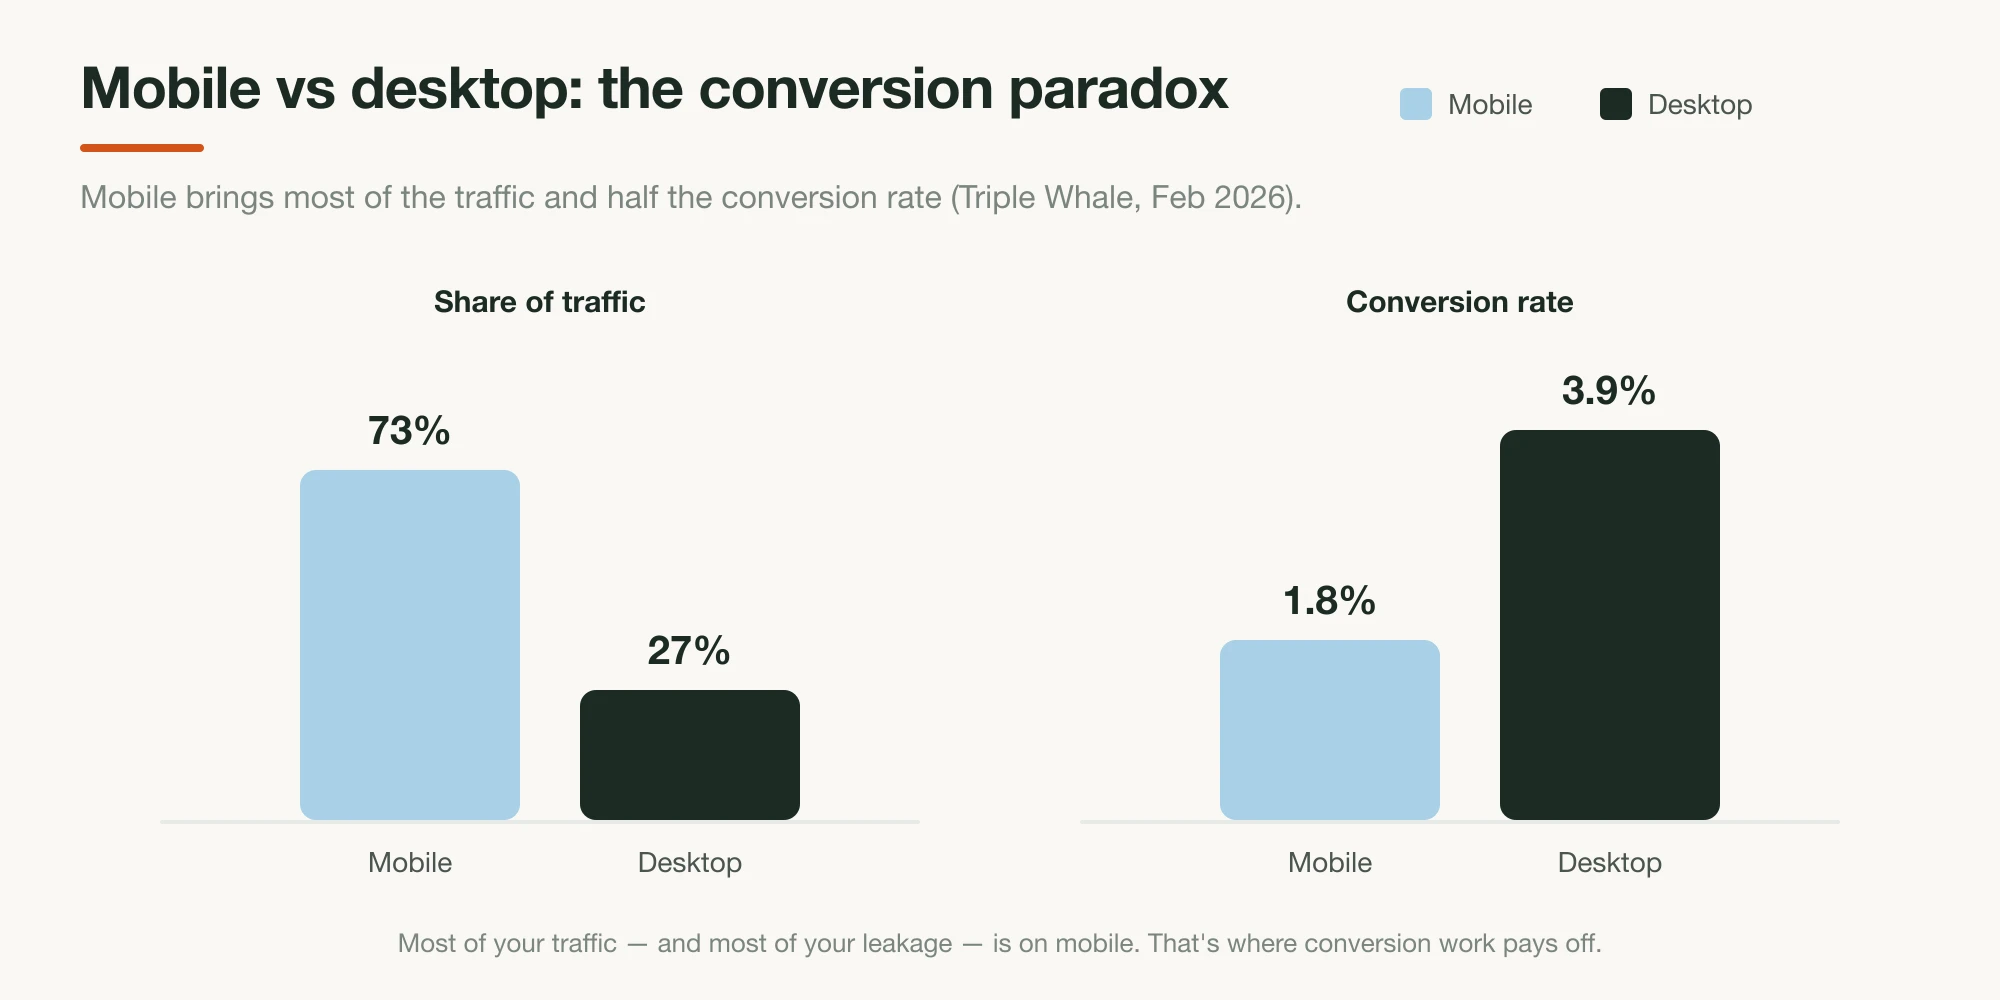
Because most of your traffic and most of your leakage are on mobile, the mobile page is where conversion work pays off most. Heavy pages, slow loads, and CTAs that fall below the fold cost the most where the visitors actually are. A high cart-abandonment baseline compounds it — the Baymard Institute's long-running research puts average cart abandonment near 70%, higher on mobile.
What top performers actually hit
Top performers roughly triple the median. Across Unbounce's 2024 ecommerce data, the top quartile of landing pages converted at 11.4%, and Triple Whale puts the top 10% of Shopify stores above 4.7% purchase conversion (February 2026). The gap between median and top decile is mostly execution — offer, page type, speed, and clarity — not category luck.
One under-used lever sits in the copy itself. Unbounce found landing pages written at a 5th-to-7th-grade reading level converted around 11.1%, versus 5.3% for professional-level prose — a reminder that on a pre-sell page, plain and scannable beats clever and dense. If you're chasing the ceiling rather than the average, that's a cheaper place to start than most: simplify the language, tighten the offer, and match the page type to the traffic. For the AI-generation route to a fast, structured page, see Replo vs Landra.
How to read these benchmarks honestly
Treat every benchmark as a question, not an answer. Before you compare your page to a number, check three things: what action it measured (purchase vs. any landing-page action — the gap between 6.6% and ~2% is almost entirely this), whose data it is (independent transaction data like IRP Commerce vs. a vendor reporting its own customers), and how current it is (a 2019 speed study still describes the right direction, but not today's exact magnitudes).
A few figures that circulate widely were left out of this roundup on purpose, because they couldn't be verified against a current primary source — including a frequently cited "218% conversion lift" with no traceable origin, and lead-generation form-fill benchmarks often mislabeled as ecommerce conversion rates. A benchmark you can't source is worse than no benchmark.
And remember that benchmarks date quickly. Pricing, traffic mix, and platform behavior shift year to year, so a figure published two years ago describes the right direction but not today's exact level — which is why every stat here carries its date. The most useful number is never the industry headline anyway; it's your own category and your own traffic source, measured the same way over time, so you're comparing this month's page against last month's, not against a stranger's dataset.
Where the page itself fits
Benchmarks set the bar; the page is how you clear it. Two levers in this data are squarely in your control: page type (a dedicated landing page or advertorial beats sending cold traffic to a product page) and speed (every second in the first three costs conversion). Both are page-build decisions, not media-buying ones.
That's the gap Landra is built to close. Give it your product and the audience you're targeting, and it generates the whole optimized page — copy, structure, and images — as a fast, conversion-shaped advertorial or listicle tuned to that traffic, in minutes. You start above the page-type and speed baselines instead of building your way up to them.
The bottom line
The honest DTC landing-page benchmark for 2026 is a range, not a number: about 1.7–2.7% for ecommerce purchases, swinging several-fold with industry, traffic source, page type, and device. Email and branded search convert highest; cold paid social lowest; dedicated landing pages and advertorials beat raw product pages; and speed quietly taxes everything. Use these to judge your own pages — but benchmark against your category and your traffic, measured consistently, and distrust any figure you can't trace to a source.
Frequently asked questions
What is a good conversion rate for a DTC landing page?
For ecommerce purchases, the real-world average sits around 1.7–2.7% depending on the dataset, with top performers above 4–5%. Beware the widely quoted 6.6% figure — that is Unbounce's all-industry median for landing-page actions like form fills, not ecommerce purchase conversion.
Why do conversion benchmarks vary so much between sources?
Because they measure different actions. Some report purchase conversion, others report any landing-page action (email signup, form fill). Some are vendor datasets from their own customers; some are independent transaction data. Industry, traffic source, and device shift the number further. Always check what action and what sample a benchmark measured.
Which traffic source converts best for DTC?
Email to existing customers and branded Google search convert highest (often several times the site average), because the visitor already knows and wants the brand. Cold paid social — TikTok and broad Meta prospecting — converts lowest, which is exactly why a pre-sell page matters most there (MHI Growth Engine, Feb 2026).
Does page speed really affect conversion rate?
Yes, measurably. Portent found ecommerce conversion rate fell from about 3.05% at a one-second load to 1.12% at three seconds. A Google-commissioned study (2019 data) found every 0.1-second mobile speed improvement lifted retail conversion by 8.4%. The exact magnitudes are dataset-specific, but the direction is consistent.
Do advertorials convert better than product pages?
For cold paid traffic, the reported answer is yes. MHI Growth Engine (Feb 2026) puts advertorial/editorial landing pages at roughly 2–5% for cold traffic versus 1.5–3.5% for sending the same traffic straight to a product page. These are practitioner benchmarks, not a controlled trial.